

The Asset insights module collects asset data, such as odometer (mileage), TPMS (Tire Pressure Monitoring System), TBS (Trailer Braking System) warning, and brake lining. It provides a quick overview of the overall asset health and any specific warnings that may require action.
View Asset Insights #
The Asset insights page provides a view of all the fleets and historical information on events.
From the left navigation pane, click Asset insights ![]() . The Asset insights page is displayed.
. The Asset insights page is displayed.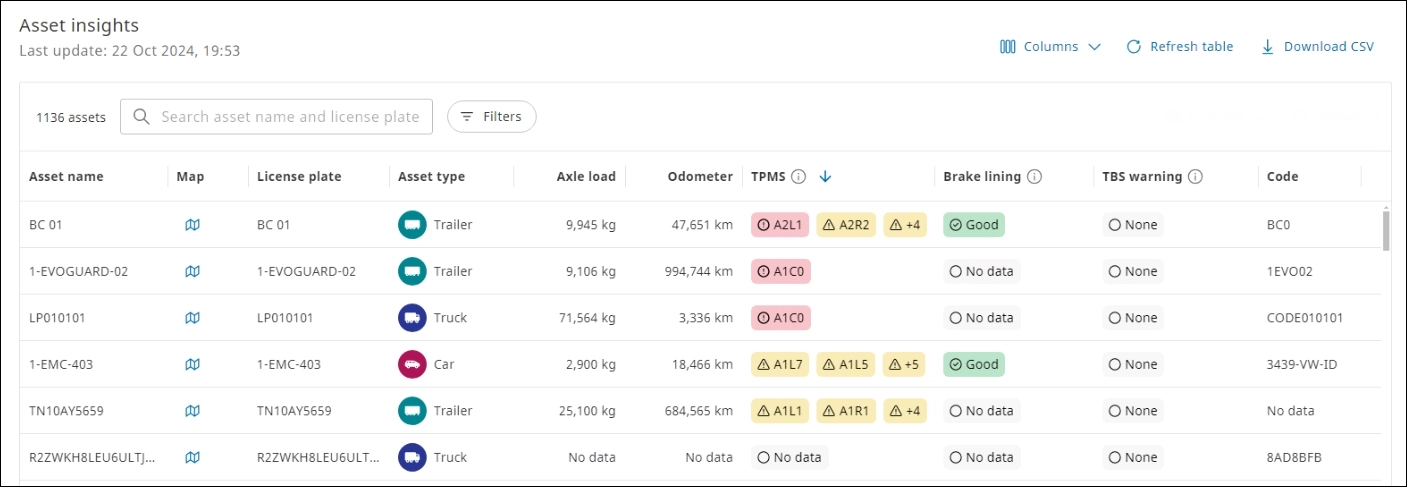

On the Asset insights page:
- The data does not auto-refresh, you must click Refresh table to fetch the latest historical data.
- To view live data of an asset, click Map
 in the Map column.
 - To sort the records in ascending or descending order, click Sort
 in the column headers.
 - To view the information dialog for TPMS, Brake lining, and TBS warning columns, click Information
 in the respective column headers.
Available fields
| Column | Description |
| Asset name | Name of the asset |
| Map | View current data of an asset in the Map module NOTE: Click the Map icon to go to the Map view. |
| License plate | Unique vehicle registration number |
| Asset type | Vehicles, such as truck, van, or trailer |
| Axle load | Total weight bearing capacity of a vehicle for all the wheels attached to an axle |
| Odometer | Tracks the distance traveled by a vehicle |
| TPMS | The location of tires on the vehicle and their tire pressure severity level  TIP: The axle number and the left or right side numbers identify the tire location on the vehicle. The numbering starts from the middle and goes outwards. For example, A2R2 is the second axle from the front and the second tire from the center on the right side. 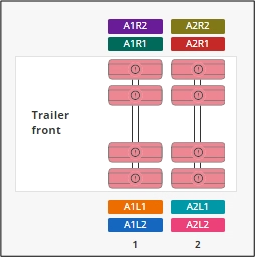 |
| Brake lining | Status of the brake pads and severity level of the required action TIP: Brake lining refers to material-like brake pads that are attached to the brake shoe to cause frictional force while braking. |
| TBS warning | The last known braking performance status |
| Code | Error code that can be referenced for troubleshooting |
Search an Asset #
On the Asset insights page, search an asset by entering the asset name or license plate number in the Search box.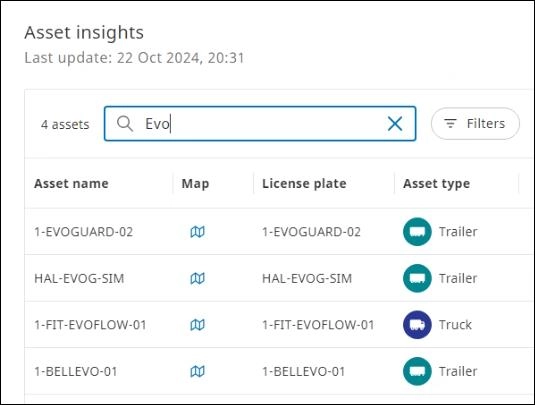
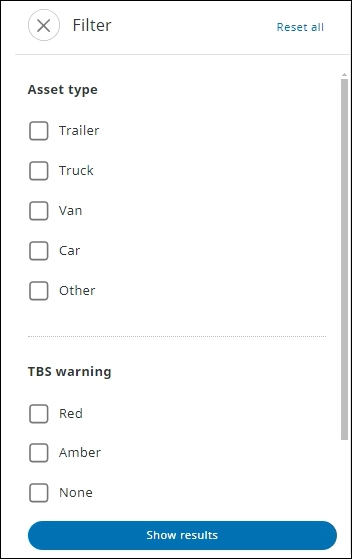
Filter Columns #
Filter data based on the asset type and warning level.
- On the Asset insights page, click Filters. The Filter pane is displayed.
- Select the required checkboxes in the Asset type, TBS warning, Brake lining, and TPMS sections, and then click Show results. The results matching the selection criteria are displayed.


NOTE: To clear all the applied filters, click Reset all.
View Asset Details #
You can view information about an asset on the Asset Details, General info, ODR files, and Brake Anomalies tabs.
- From the left navigation pane, click Asset insights
 . The Asset insights page is displayed.
 - Select the required asset from the asset list. The Asset details tab is displayed on the specific asset information page.
Most data can only be recorded when an asset is moving, not when it is standstill position.
Asset details #
You can view historical data for an asset in the Speed and axle load history, TPMS temperature history, and TPMS pressure history charts. You can also view the Wheels status.
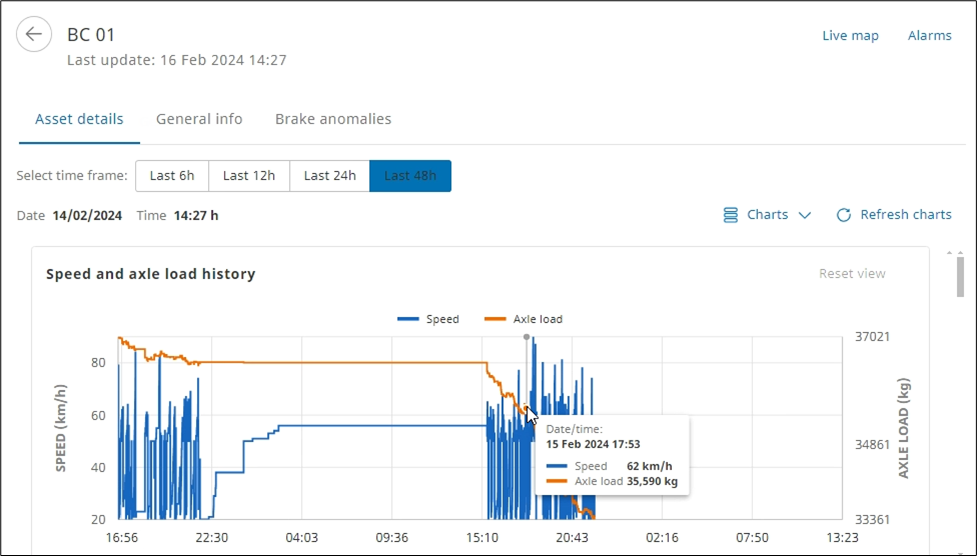
- To view data for a specific time, hover your cursor over a specific point on the graph.
- A flat line in the graph indicates the asset is in standstill.
- To pull in the latest data, click Refresh charts.
View Data for a Specific Time #
You can view the historical information of assets for a specific time frame.
On the Asset details tab > click calendar  , and then select the required date. The data for the selected time frame is displayed in the charts.
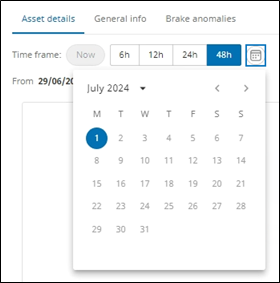
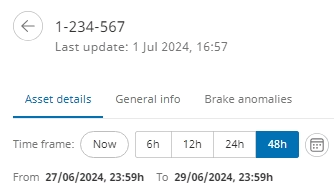
- You can select one of the pre-defined Time frame tabs. The maximum time frame you can select is 48 hrs.
- The Last update field indicates the time when the data was last updated.
- The From and To fields indicate the period for which the data is displayed.
Filter Charts #
Filter charts to view specific graphs on the Asset details tab.
- On the Asset details tab > click Charts. The Chart Display list is displayed.

- Select the required chart options. The results matching the selection criteria are displayed.
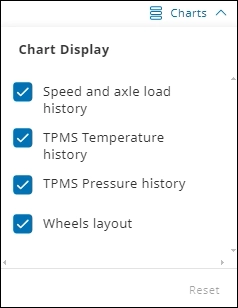
To restore the default filter settings, click Reset.
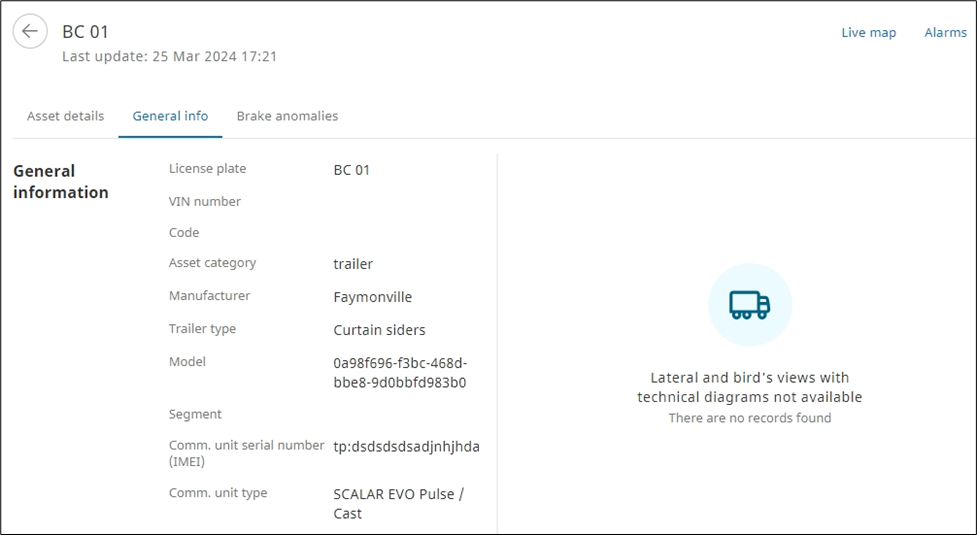
General Info #
You can view general asset information and the technical diagram of the asset.
ODR Files (only available for users who have subscribed to the Asset insights pro package) #
ODR is a file format that provides information about the onboard computer data recorded for an asset.
NOTE: The ODR (Onboard data recording) files feature is available to users who have subscribed to the Asset insights pro package. ODR is a file format that provides information about the onboard computer data recorded for an asset.
- You must have Asset insights pro subscription and the ODR feature enabled to access and download the ODR (onboard data recorder) tab files.
- A new version of the ODR files is available daily for each asset, and each new file adds data to the previous file.
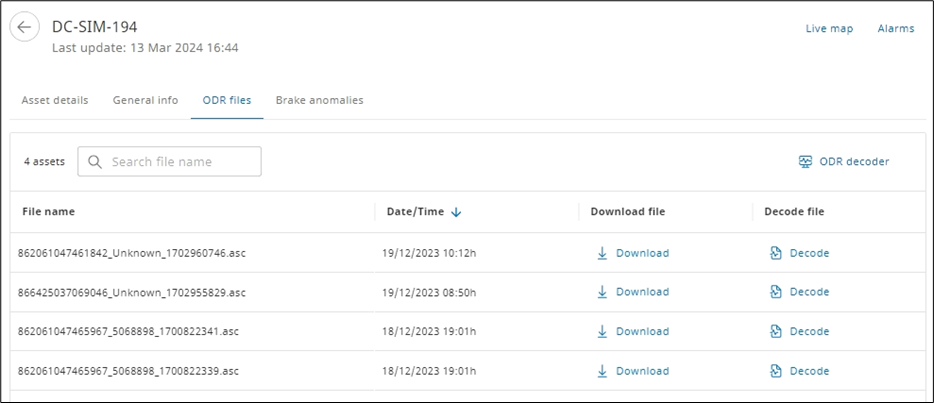
Available Columns #
| Columns | Description |
| File name | Unique name of the ODR file |
| Date/Time | Date of when the ODR file was downloaded |
| Download file | Option to download the file |
| Decode file | Option to decode the file |
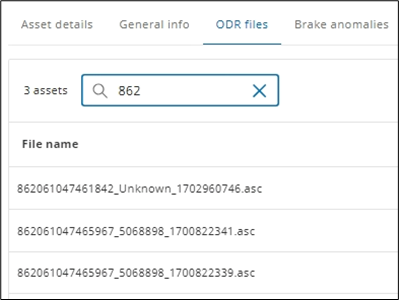
Search an ODR file #
On the ODR tab, search a specific ODR file in the Search box.
Download an ODR File #
Download specific ODR files from the Download file column.
On the ODR files tab > click Download on the required file in the Download file column. The specific ODR file is downloaded to the default Downloads folder.
- The ODR files are only available to download and decode for Wabco Electronic Braking Systems.
- If no ODR files are available in the data table, it could be because they are not Wabco EBSs, or the trailer is not configured to upload the ODRs.
Decode an ODR File #
Decode specific ODR files from the Decode file column.
On the ODR files tab > click Decode on the required file in the Decode file column. The ODR Decoder page is displayed in a new browser tab.
On the upper right corner, click ODR decoder to open a publicly accessible link. An external user can open an ODR file (.asc) shared with them on the public decoder platform to view the file content.
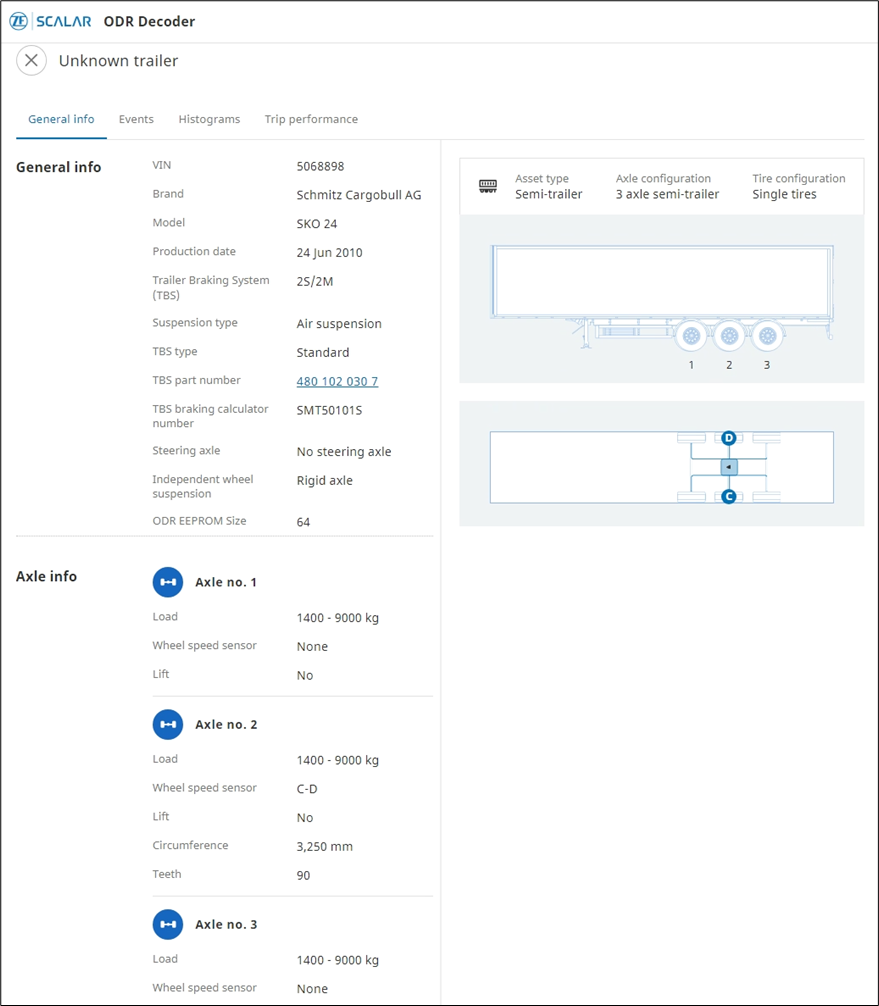
View a Decoded ODR File #
On the ODR Decoder page, you can view the asset information tabs: General info, Events, Histograms, and Trip performance.
General info
You can view the General info, Axle info, and graphical representation of the asset.
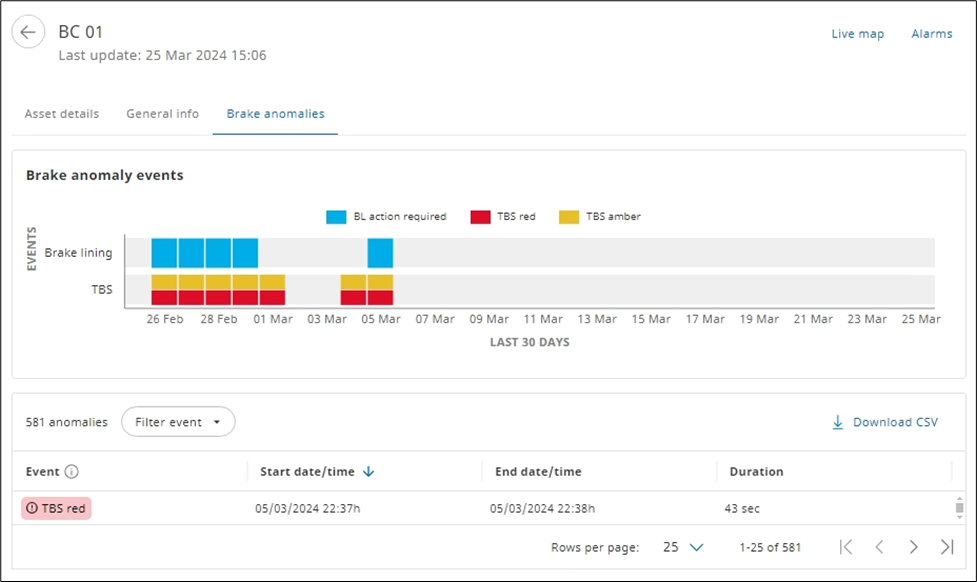
Brake Anomalies #
You can view historical events for brake lining or TBS warning issues.
Filter Events #
Filter events to view specific issues on the Brake anomalies tab.
- On the Brake anomalies tab > click Filter event. The Event list is displayed.

- Select the required checkboxes. The results matching the selection criteria are displayed.
NOTE:To clear all the filters applied, click Reset.
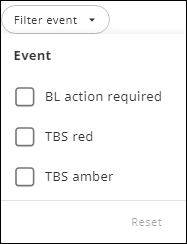
Events available
| Anomaly event | Description |
| BL action required | Action required on the brake lining issue |
| TBS red | Critical TBS issue |
| TBS amber | Warning TBS issue |
Download CSV #
You can download the CSV (comma-separated values) file to maintain the data on brake lining and TBS anomalies.
On the Brake anomalies tab > click Download CSV. The Excel file is downloaded to the default Downloads folder.
View an Asset on Live Map #
You can view the live data of an asset in the Map view.
On the asset information page of an asset, click Live map. The live information of the selected asset is displayed in the Map view.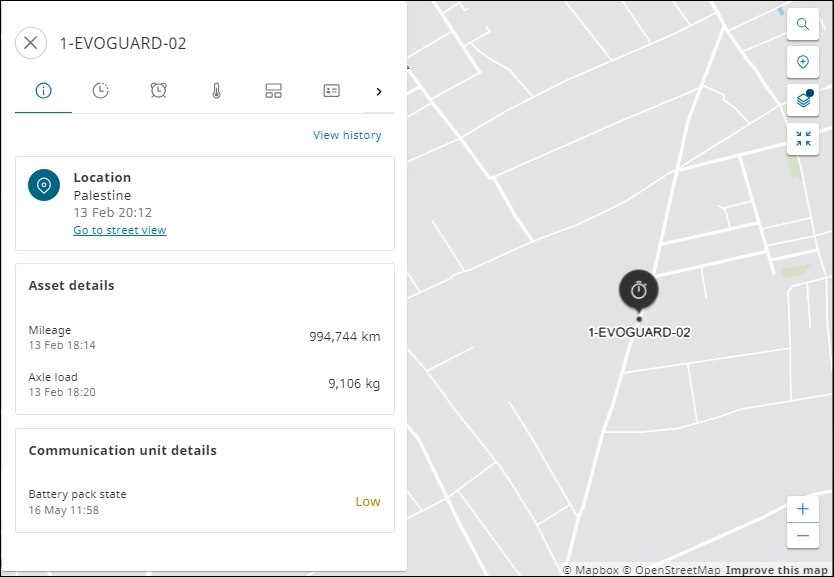
To go back to the Asset information page, click Asset insights ![]() on the asset information pane.
on the asset information pane.
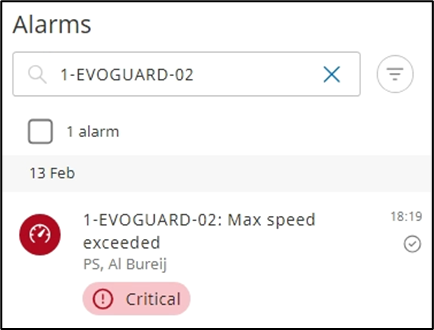
View Alarms for an Asset #
You can view all the alarms recorded for a specific asset.
On the asset information page of an asset, click Alarms. The alarms related to the asset are displayed in the Alarms module.
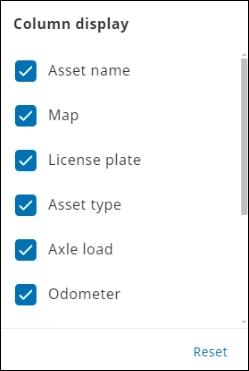
Custimize Column View #
You can choose to display or hide columns on the Asset insights page.
- On the Asset insights page > click Columns. All the columns described in the View Asset Insights section are listed.

- To show or hide columns, in the Column display list, select or clear the checkboxes. The asset insight information view is rendered based on the selected columns.
Refresh Table #
The data displayed on the Asset insights page is static and not live. To fetch the latest data from the database, on the Asset insights page, click Refresh table. The data is refreshed and displayed on the Assets insights page.
NOTE: The data from the sensors flows into the database.
Download CSV File #
You can download the CSV file to maintain the data of active assets on your machine.
- From the left navigation pane, click Asset insights . The Asset insights page is displayed.
- Click Download CSV. The Excel file is downloaded to the default Downloads folder.
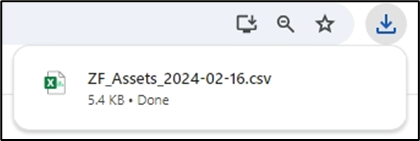
After the CSV file is downloaded, you can open it from the Recent download history in the browser or the Downloads folder in the File Explorer.


