

In the ECO performance module, ECO coaches evaluate the behavior of drivers and their impact on the fleet performance according to the defined KPIs (Key Performance Indicators). Based on the evaluation, the drivers are assigned grades.

One driver is assigned to only one coach. A coach cannot view drivers assigned to other coaches and profiles.
Getting started in ECO Performance #
You can view the historical data and performance trends for all the trips completed by drivers over a selected period.
Add drivers and allow data usage #
To view the ECO Performance page, at least one driver must first be added on the Drivers tab, and data consent must be provided as per GDPR (General Data Protection Regulation) compliance. If no drivers are added, you will be directed to the Drivers page after you click the ECO performance module. For more information, see how to add a driver.
View ECO Performance Overview #
From the left navigation pane, click ECO performance ![]() . The Eco performance page is displayed.
. The Eco performance page is displayed.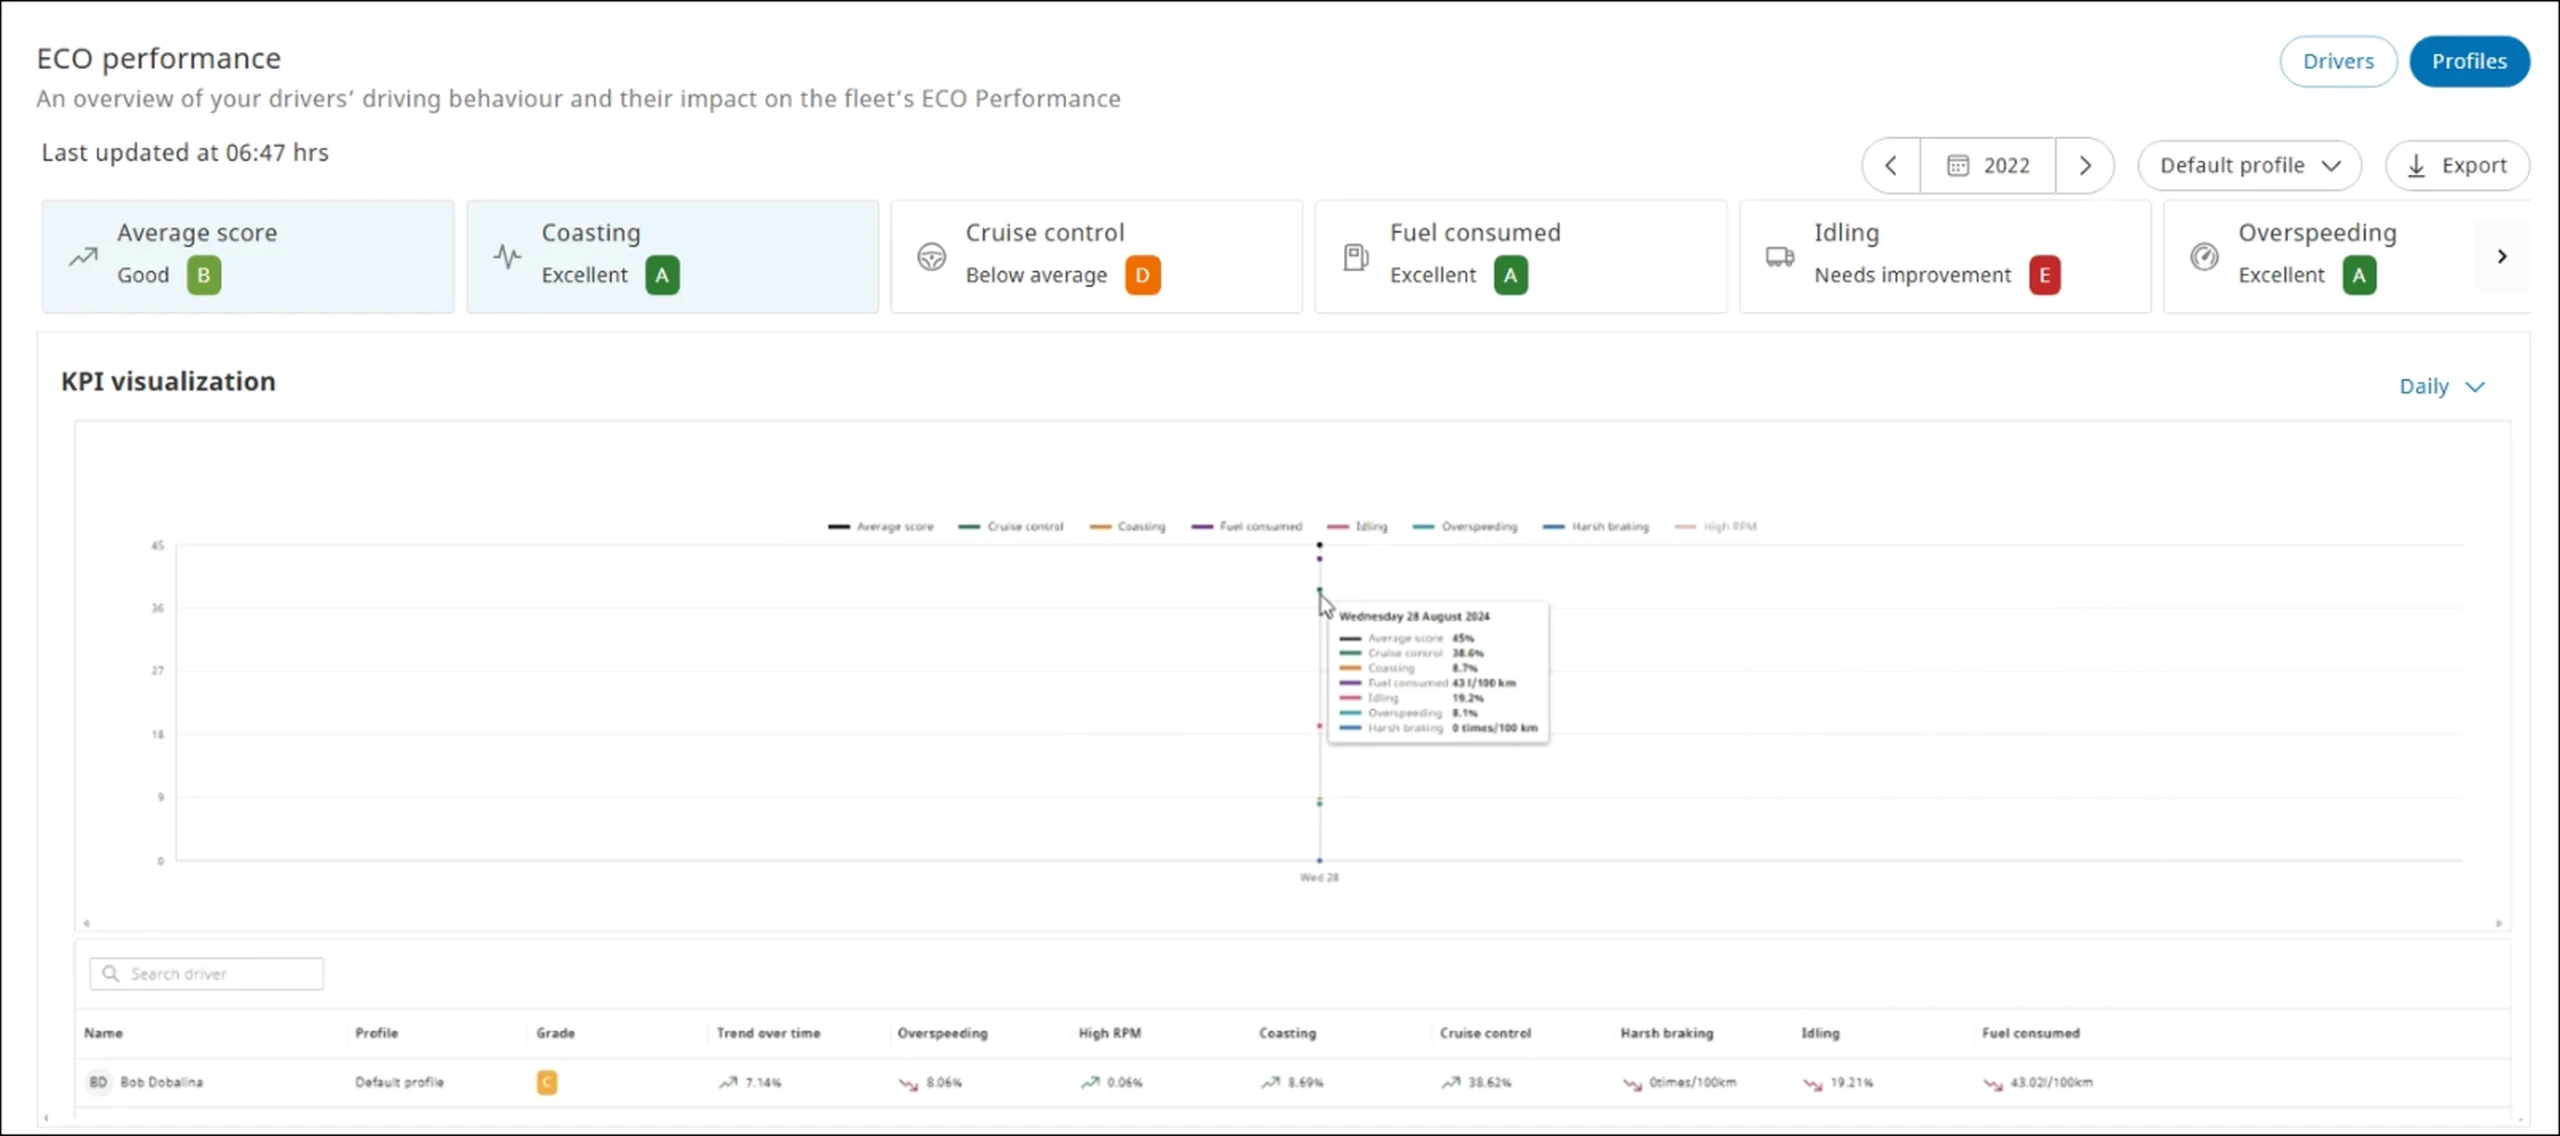
Near real-time refresh of ECO data
Access to near real-time ECO data enables coaches to provide timely feedback to drivers, allowing them to initiate preventive measures or corrective actions when needed. The latest trip completed can be evaluated so that drivers can promptly adapt their behavior.
Therefore, the data for trips completed by a driver who is assigned to a coach (specific to the profiles created by the coach) and recorded between 8:00 AM CET and 8:00 PM CET will be refreshed on an hourly basis. For example, for a trip completed at 4:50 PM CET, the coach and the driver will be able to view the updated ECO data after the hourly refresh, which is scheduled at 5:00 PM CET.
In the image shown above, the data was last updated at 06:47 PM CET.
The hourly refresh occurs from 8:00 AM CET to 8:00 PM CET. This time will vary based on the connected user’s locale settings.
The last updated time or the near-refresh data will only be displayed for the current (today’s) date. Historical data (up to the day before) can be accessed at any time.
Implications
- The ECO data displayed will nearly be in real-time.
- The scores and KPIs will be consistent across both the web (dashboard) app for the coach and the SCALAR Cargo app, with the same refresh rate applied to both.
- All grades are calculated for drivers who have completed a trip during the refresh rate hours.
- If a driver has started an ECO trip, but has not completed it yet, the status will indicate that they are currently driving, and no grade will be displayed.
- If a driver starts and completes an ECO trip before 8:00 AM CET, the ECO score will be calculated and displayed for that day.
- If the ECO trip starts or ends after 8:00 PM CET, the ECO scores will be calculated and displayed the next day at 8:00 AM CET.
- The trip details of the day show the grade and score values for the last completed trip. They do not include a comparison to the fleet average at that time.
- The cumulative average grade of the driver for all the KPIs is available on the Average scorecard, and the average grade for a specific KPI is available on the respective KPI card.
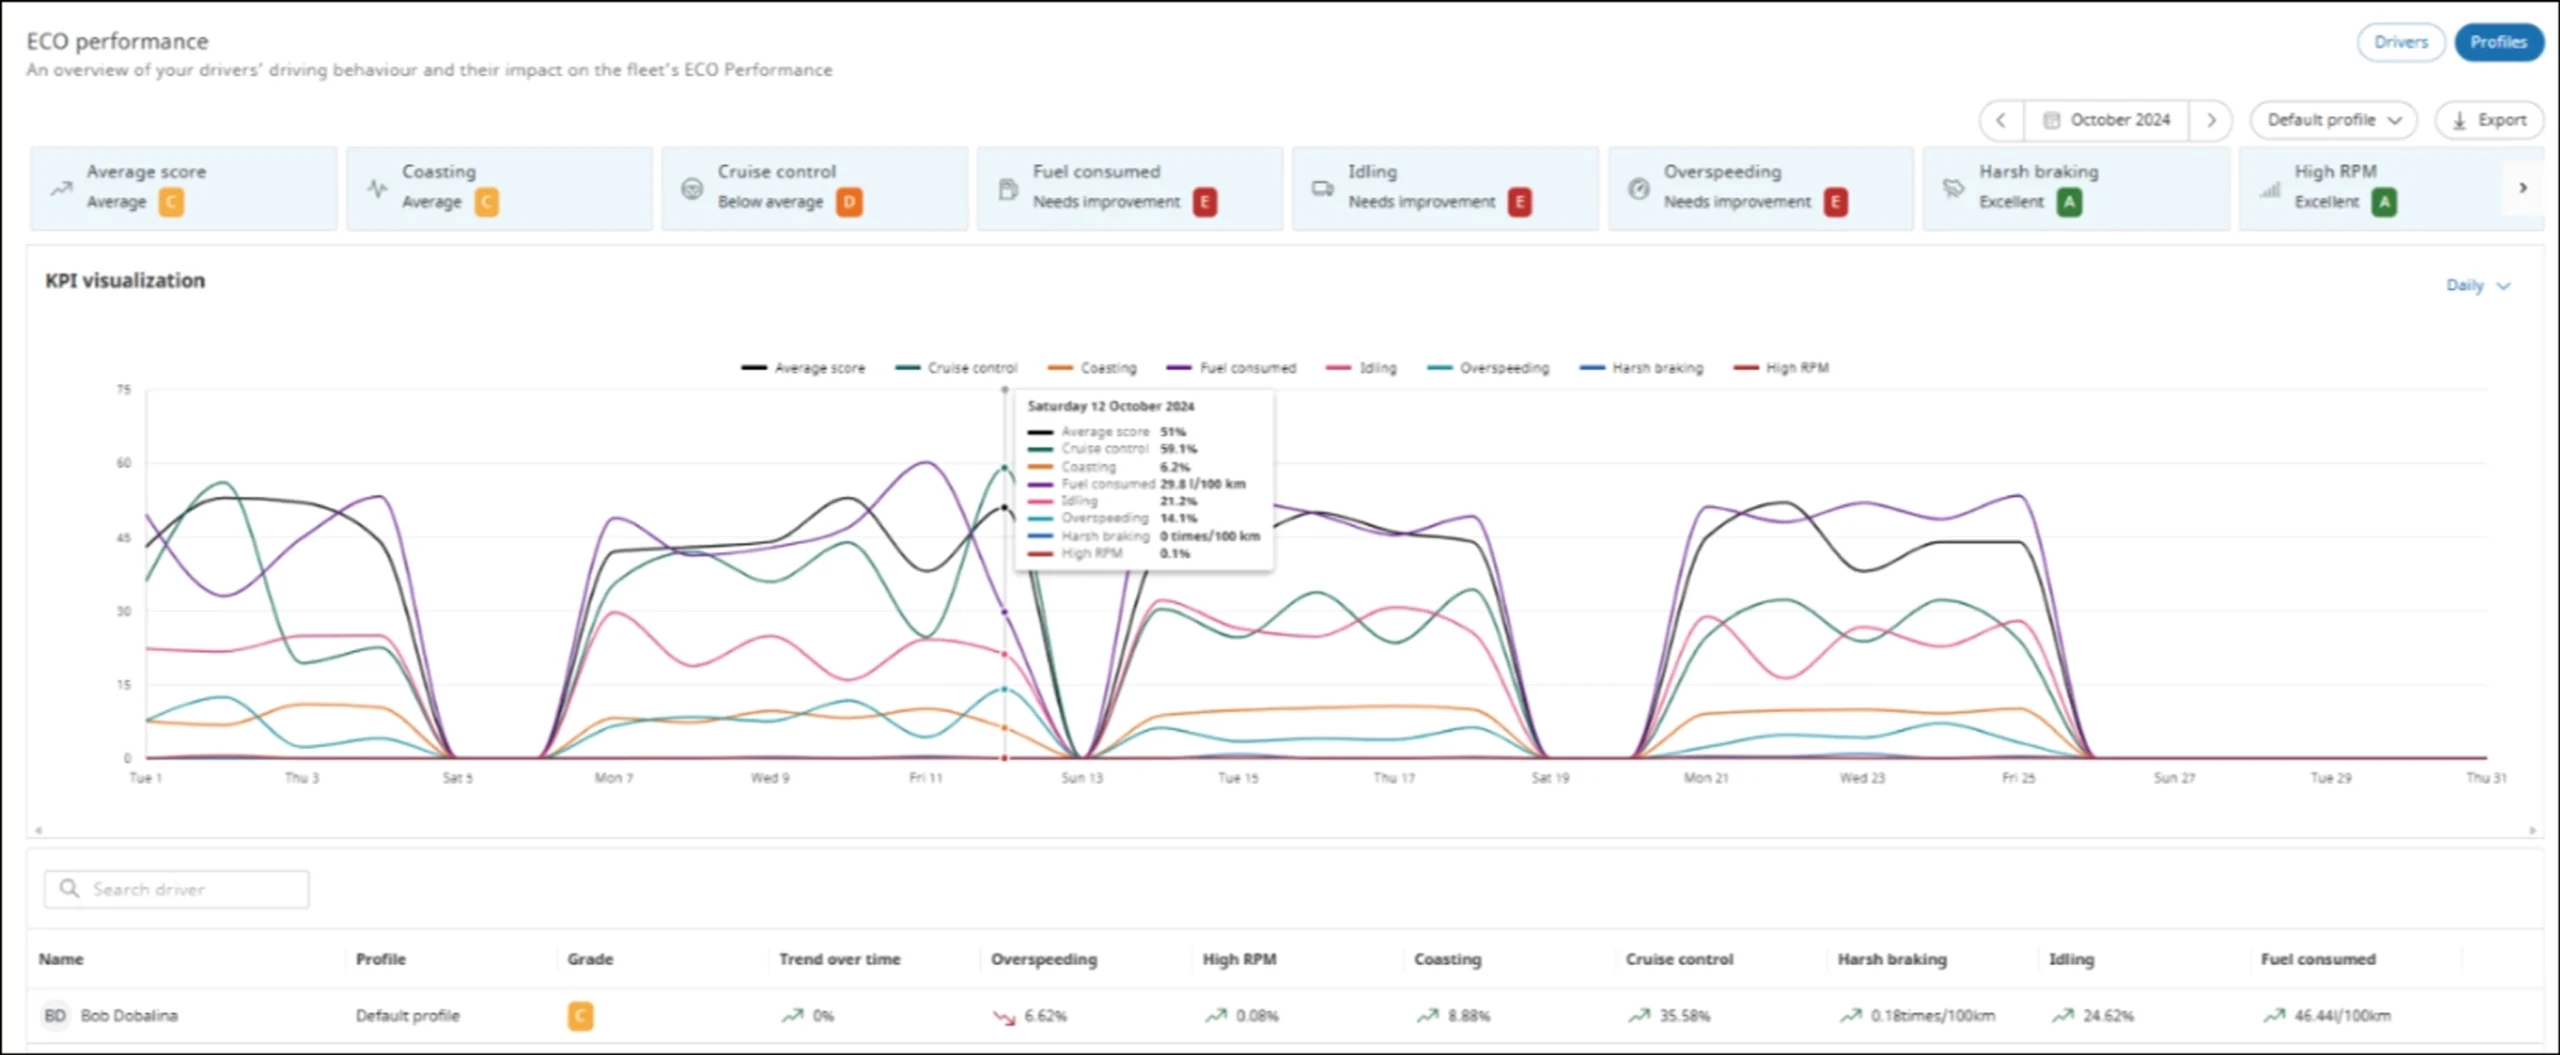
- Select the specific KPI cards available at the top of the ECO performance page to view their graphical representation on the KPI visualization graph.
- Hover the cursor at any point on the graph to view the KPI information for a specific time. Hover at any point on the Y axis to view the accumulated data for the entire feed on the page.
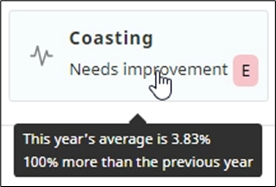
- Hover over a specific KPI card to view information about the current performance of a driver as compared to the previous period.

Filter ECO Performance Data #
Driver trip records can be filtered at two levels: the ECO Performance page and the KPI visualization graph.
From the left navigation pane, click ECO Performance ![]() . The Eco performance page is displayed.
. The Eco performance page is displayed.
- To view data for the current day, click Today/Now.
- To go to the next or previous year, week, month, or day (based on the time frame selection), click the forward or backward arrow
 .
.
 .
.ECO performance page #
Filter ECO performance data for all available drivers on the ECO Performance page.
- On the Eco performance page > click the date picker. The date picker dialog is displayed.

- Select the required option: Day, Week, Month, or Year, and then click Ok. The data as per the selection criteria is displayed on the page.
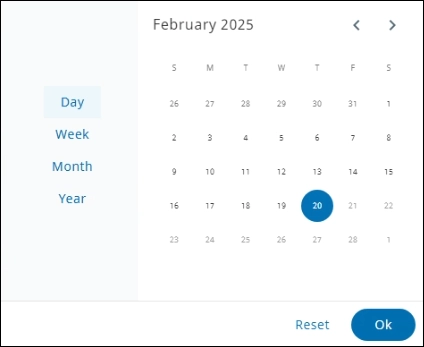
To cancel the date selection, click Reset.
KPI Visualization #
Filter data based on the Daily, Weekly, or Monthly options on the KPI visualization graph.
Select the Monthly filter option on both the Filters pane and KPI visualization chart to view the required data. The average accumulated data for the entire month is represented as a single vertical line on the graph.
Available KPIs #
| KPI | Description |
| Coasting | Distance driven without accelerator pressed. Criteria for coasting are: Driving (speed > 2 km/hour) Brake switch off (no braking detected) Clutch pedal not pressed (0%) Accelerator pedal not pressed (0%) No fuel consumption (< 2 l/hour) Cruise control off |
| Cruise control | Using cruise control in the vehicles to drive at a constant speed |
| Fuel consumed | Fuel consumed by the vehicle |
| Idling | Vehicle is idling when RPM (Revolutions Per Minute) > 0, speed < 2 km/h and PTO is off |
| Overspeeding | Driving over the recommended speed limit |
| Harsh braking | The vehicle decelerates too suddenly. The configured harsh braking threshold exceeded (default: 1,5 m/s²) |
| High RPM | Maximum allowed RPM for an engine |
The performance score of a driver is evaluated on the average score of the KPIs. A grade is assigned based on this score.
INFORMATION: Grades are assigned according to the following score range.
| Grade | Score |
| A | 4 to 5 |
| B | 3 to 4 |
| C | 2 to 3 |
| D | 1 to 2 |
| E | 0 to 1 |
View ECO Performance Data for a Driver #
You can view details of the trips and performance of a driver on the Performance, ECO trips, and Notes tabs.
The trip performance data of a driver is related to only one fleet.
On the ECO performance page > click Drivers > and then select the driver. The specific driver details page is displayed.
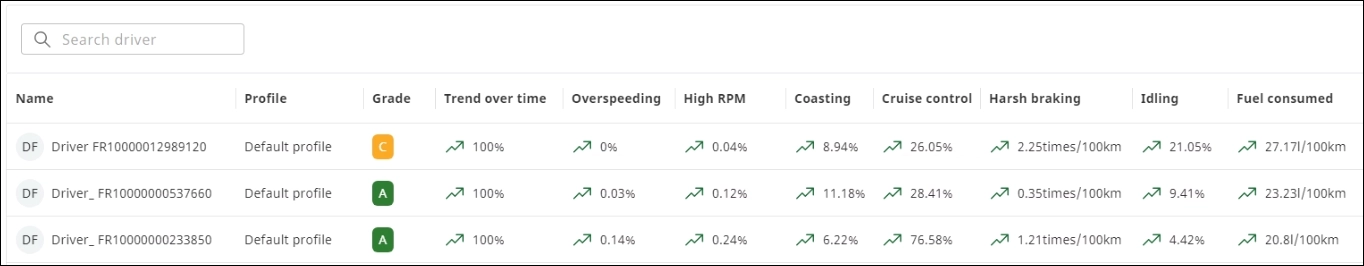
- On the ECO Performance page, scroll through to view the drivers assigned to the profile. Use the “Search driver” box to search a driver. Only those drivers that are added to the selected profile on the Profiles page are available in the list.
- The average performance trend line (up, down, or constant) denotes the driver performance over their previous trips. The performance can be improving, deteriorating, or constant based on the comparison to the previous trips over a specific period.
- The percentage next to the trend line in each column represents the driver performance for the current month.

View the KPI visualization for a driver
On the ECO performance page > scroll through to view the driver list, and then select the required driver. The KPI visualization section for the selected driver is displayed.
Available tabs
| Tabs | Description |
| Performance | Graphical data representation of the ECO performance of a driver |
| ECO trips | List of all the trips completed |
| Notes | Notes added by the coach |
Performance #
The statistical and graphical data available for the driver is charted.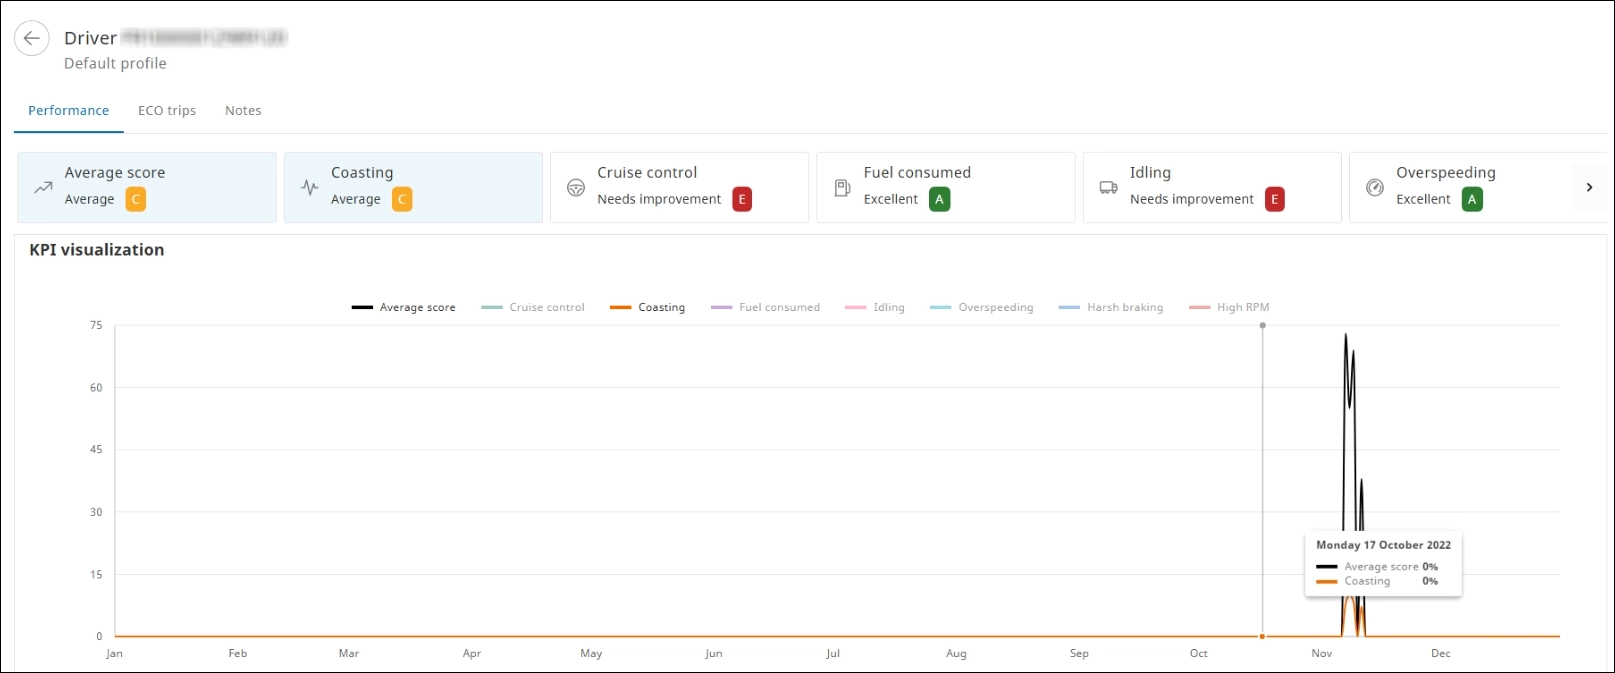
Select specific KPI cards available to view selected data on the KPI visualization graph.
ECO trips #
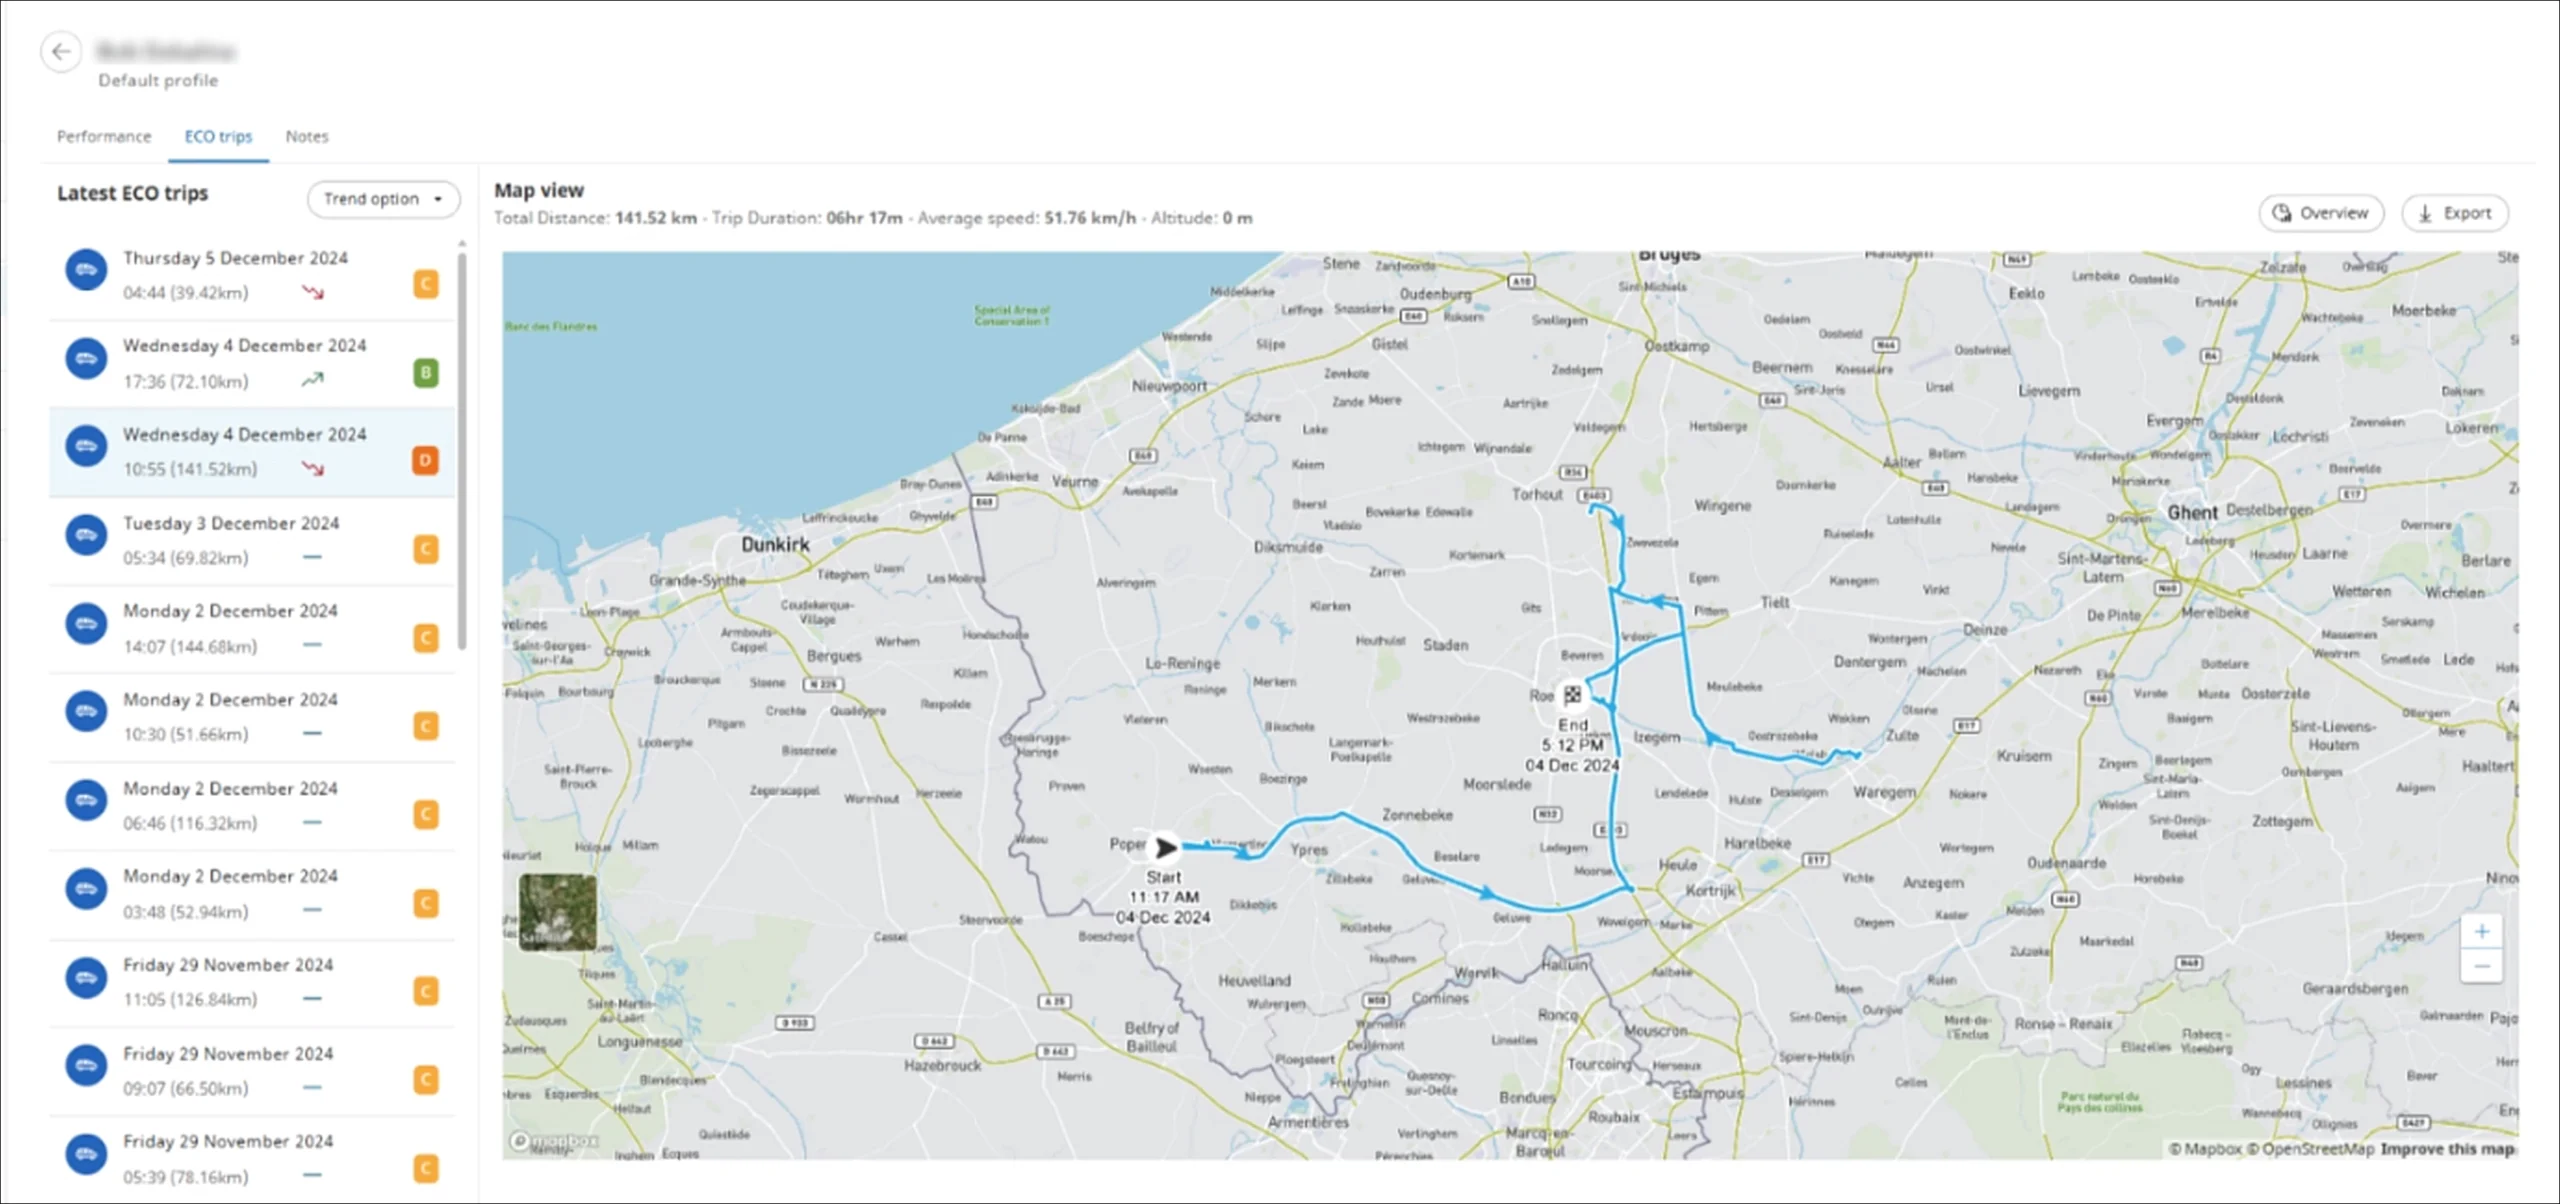
The history log of all the trips completed by a driver during the selected period is displayed.
- On the Latest ECO trips pane, you can compare the performance trend and grade for all the trips completed by a driver to evaluate their performance over time. The trip data is related to only one fleet.
- Information about the date, duration, and total distance is displayed on the pane.
- The histogram represents the average percentage and grade comparisons between the specific fleet and the assigned driver for each KPI.
Filter ECO Trips #
You can filter trip records based on the trend status.
- On the ECO trips tab, on the latest ECO trips pane, click Trend option. The Filter By list is displayed.
- Select the required option from the list. The trip results are displayed based on the selection.


Eco Trip Map View #
You can view specific ECO trip data on the map.
- On the ECO trips tab, select the required trip from the Latest ECO trips pane. The trip details pane is displayed.
- Click Map view. The ECO trip data is displayed on the map.

Export ECO Trip #
- On the ECO trips tab, select the required trip from the Latest ECO trips pane. The trip details pane is displayed.
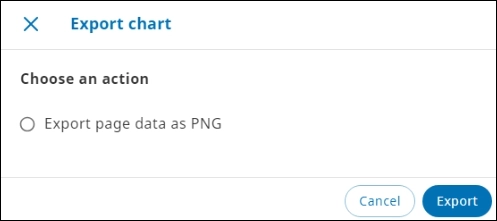
- Click Export. The Export chart dialog is displayed.

- Select the Export page data as PNG option, and then click Export. The ECO trip graph is saved to the default Downloads folder as an image.
Notes #
Coaches can add, edit, or delete a note from the Notes tab.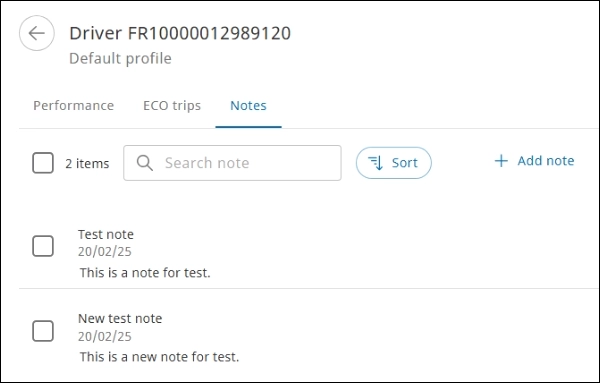
Click Sort to view notes based on chronological order.
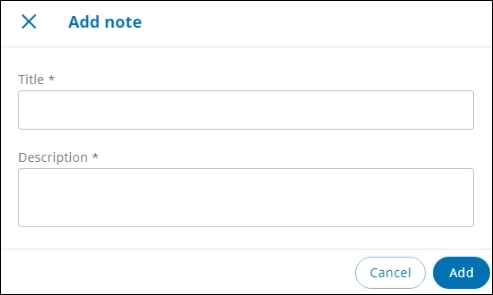
Add a Note #
You can add notes or observations for future reference.
- On the Notes tab, click Add note. The Add note dialog is displayed.

- Enter information in the Title and Description boxes, and then click Add. A new note is added.
Edit a Note #
You can edit the notes from the Notes tab.
- On the Notes tab, select the required note to be modified. The Edit option is displayed.

- Click Edit. The Edit note dialog is displayed.
- Modify the information in the Title and Description boxes, and then click Save. The note is modified.
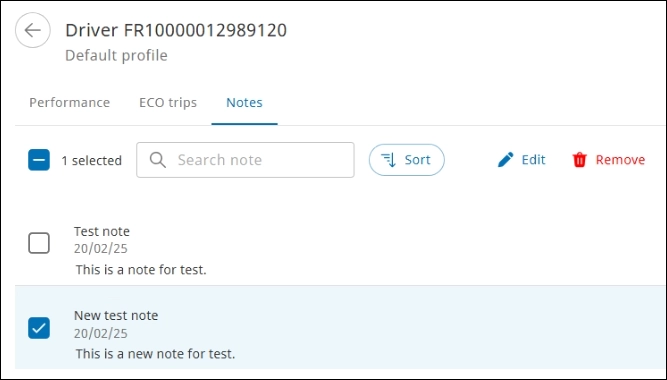
If you select more than one note, the Edit option disappears.
Remove a Note #
You can remove the notes that are not required anymore.
- On the Notes tab, select the note to be deleted. The Remove option is displayed.
- Click Remove. The Delete Notes dialog is displayed.
- Click Delete to confirm the action. The note is deleted.
To select all the notes available, click the total number of items checkbox ![]() .
.
Export ECO Performance Chart #
You can export a KPI visualization graph for all the drivers added to a specific profile.
The overall performance data for a driver cannot be exported. However, you can export performance data for a trip.
- From the left navigation pane, click ECO performance
 . The ECO performance page is displayed.
 - Click Export. The Export chart dialog is displayed.
- Select the Export page data as PNG option, and then click Export. The trip performance graph is saved to the default Downloads folder as an image.
View Profiles and Drivers #
Manage profiles and drivers to categorize resources based on the topography of the delivery region.
- From the left navigation pane, click ECO performance . The ECO performance page is displayed.
- Click Profiles. On the Profiles page, the profiles assigned to you are listed on the My profiles tab.

Add a Profile #
You can create your custom profiles and add drivers to them based on the topography.
- By default, all drivers are assigned to the system profile. The system profile KPI values and assigned drivers cannot be edited.
- One driver can be added to only one profile. Coaches cannot view or select drivers added to other profiles.
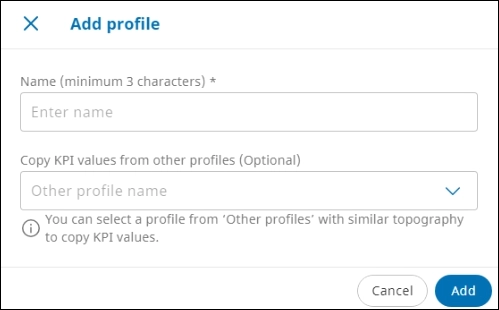
- On the Profiles pane, click Add profile. The Add profile dialog is displayed.

- In the Name box, enter a name for the profile. Optionally, in the Copy KPI values from other profiles box, select a profile with similar topography to copy its KPI values to this profile, and then click Add. A new profile will be added to the profiles list.
Activate or Deactivate Profile #
If a profile is not required anymore, you can deactivate it.
- On the Profiles pane, on the My Profiles tab > click Active on the required profile. The shortcut menu is displayed.

- Click the Inactive option. The profile is deactivated.
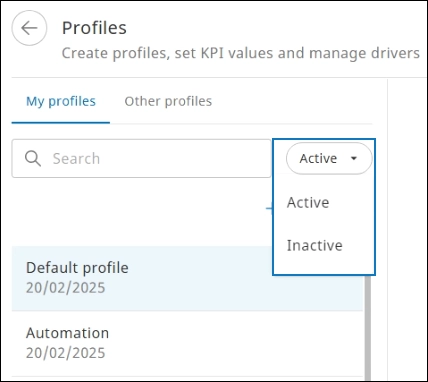
The Active and Inactive options also enable you to filter the records. To view all inactive profiles, click Inactive.
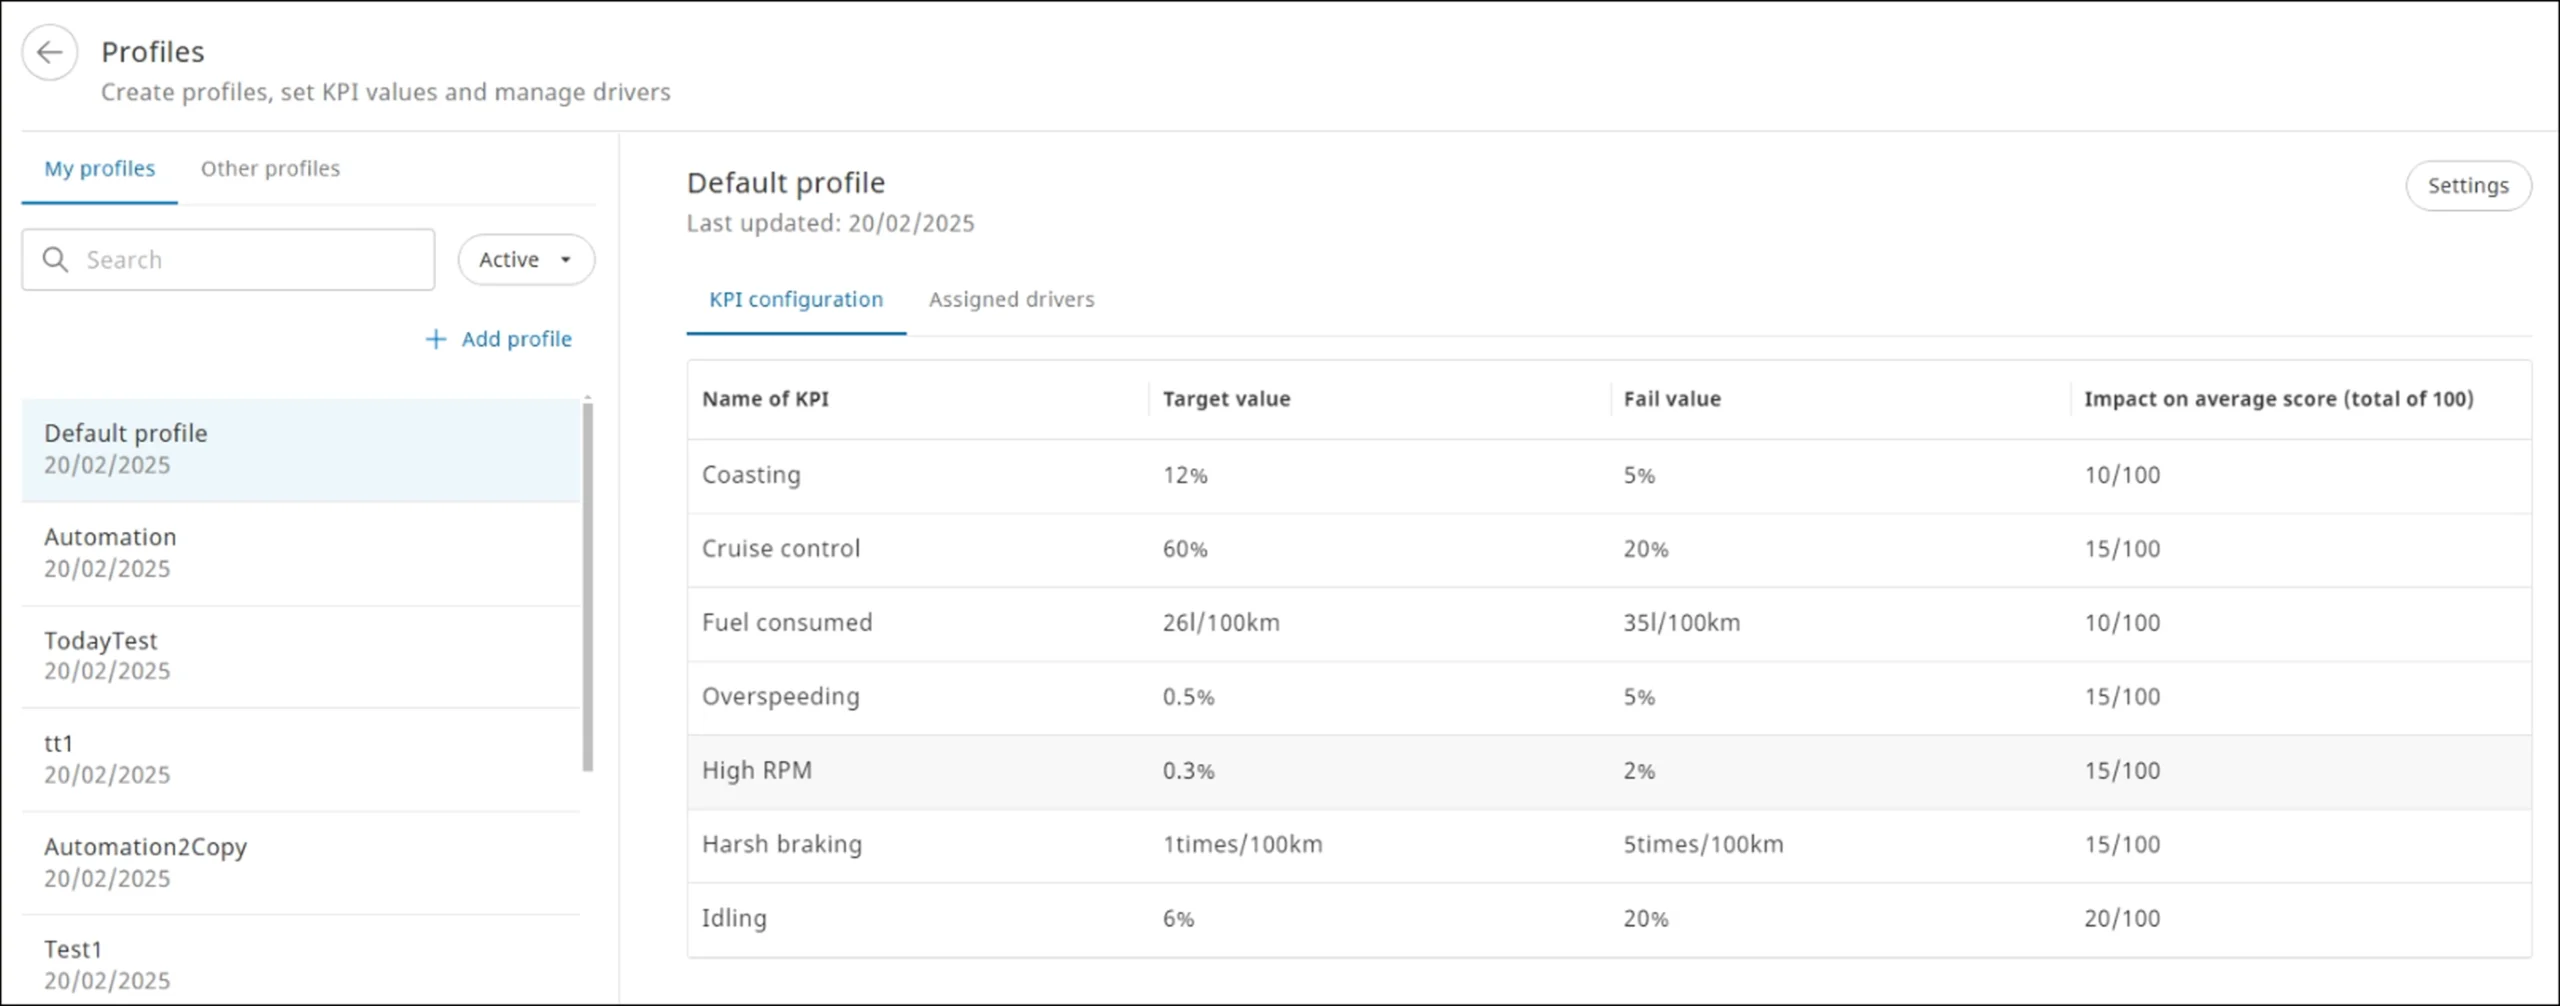
Configure KPI Values #
You can configure target, fail, and impact values for KPIs for both active and inactive profiles.
- Target: General target score set for a KPI.
- Fail: A score that falls below the threshold or target value set for a specific profile.
- Impact: The impact of a sub-score on the average score; this value cannot be negative.
Fail value can be different for individual profiles. The fail % can be different based on the fail value of the ECO coach sets for a specific profile, for example it can be 5% or 50%.
If the weightage for the total score is set to 0, the sub-score is not accounted for while calculating the total score.
- On the Profiles tab, select the required profile from the Active or Inactive tab. The specific profile details page is displayed.
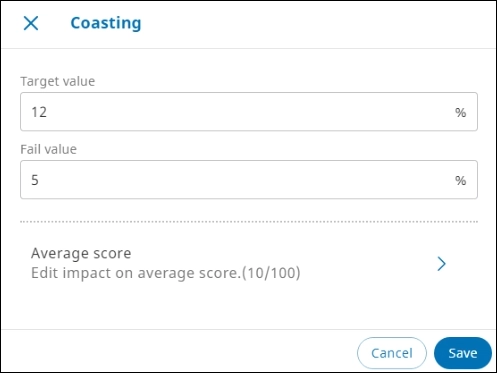
- On the KPI configuration tab, select a KPI to configure values, and then click Settings. The specific KPI dialog is displayed. In this example, the KPI values are being set for Coasting.

- In the Target value and Fail value boxes, modify the values as required.
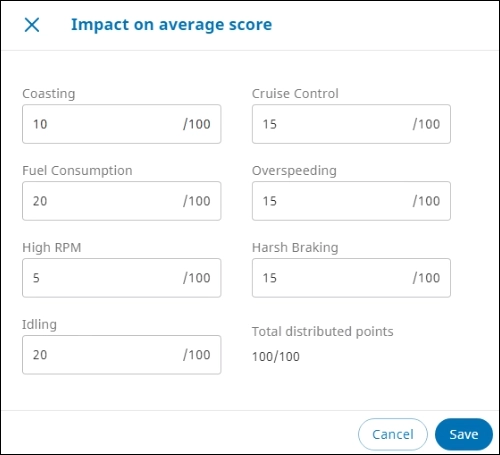
- To modify the impact value, click Edit impact on average score. The Impact on average score dialog is displayed.

- Modify values in the required boxes, and then click Save. The KPI for the selected parameter is configured based on the modified values.
- The grade assigned to a driver for a KPI is based on the target and fail values for the respective KPI. The grade range is from A (highest) to E (lowest).
- The average score grade is assigned based on the average impact value of all the KPIs.
Add a Driver #
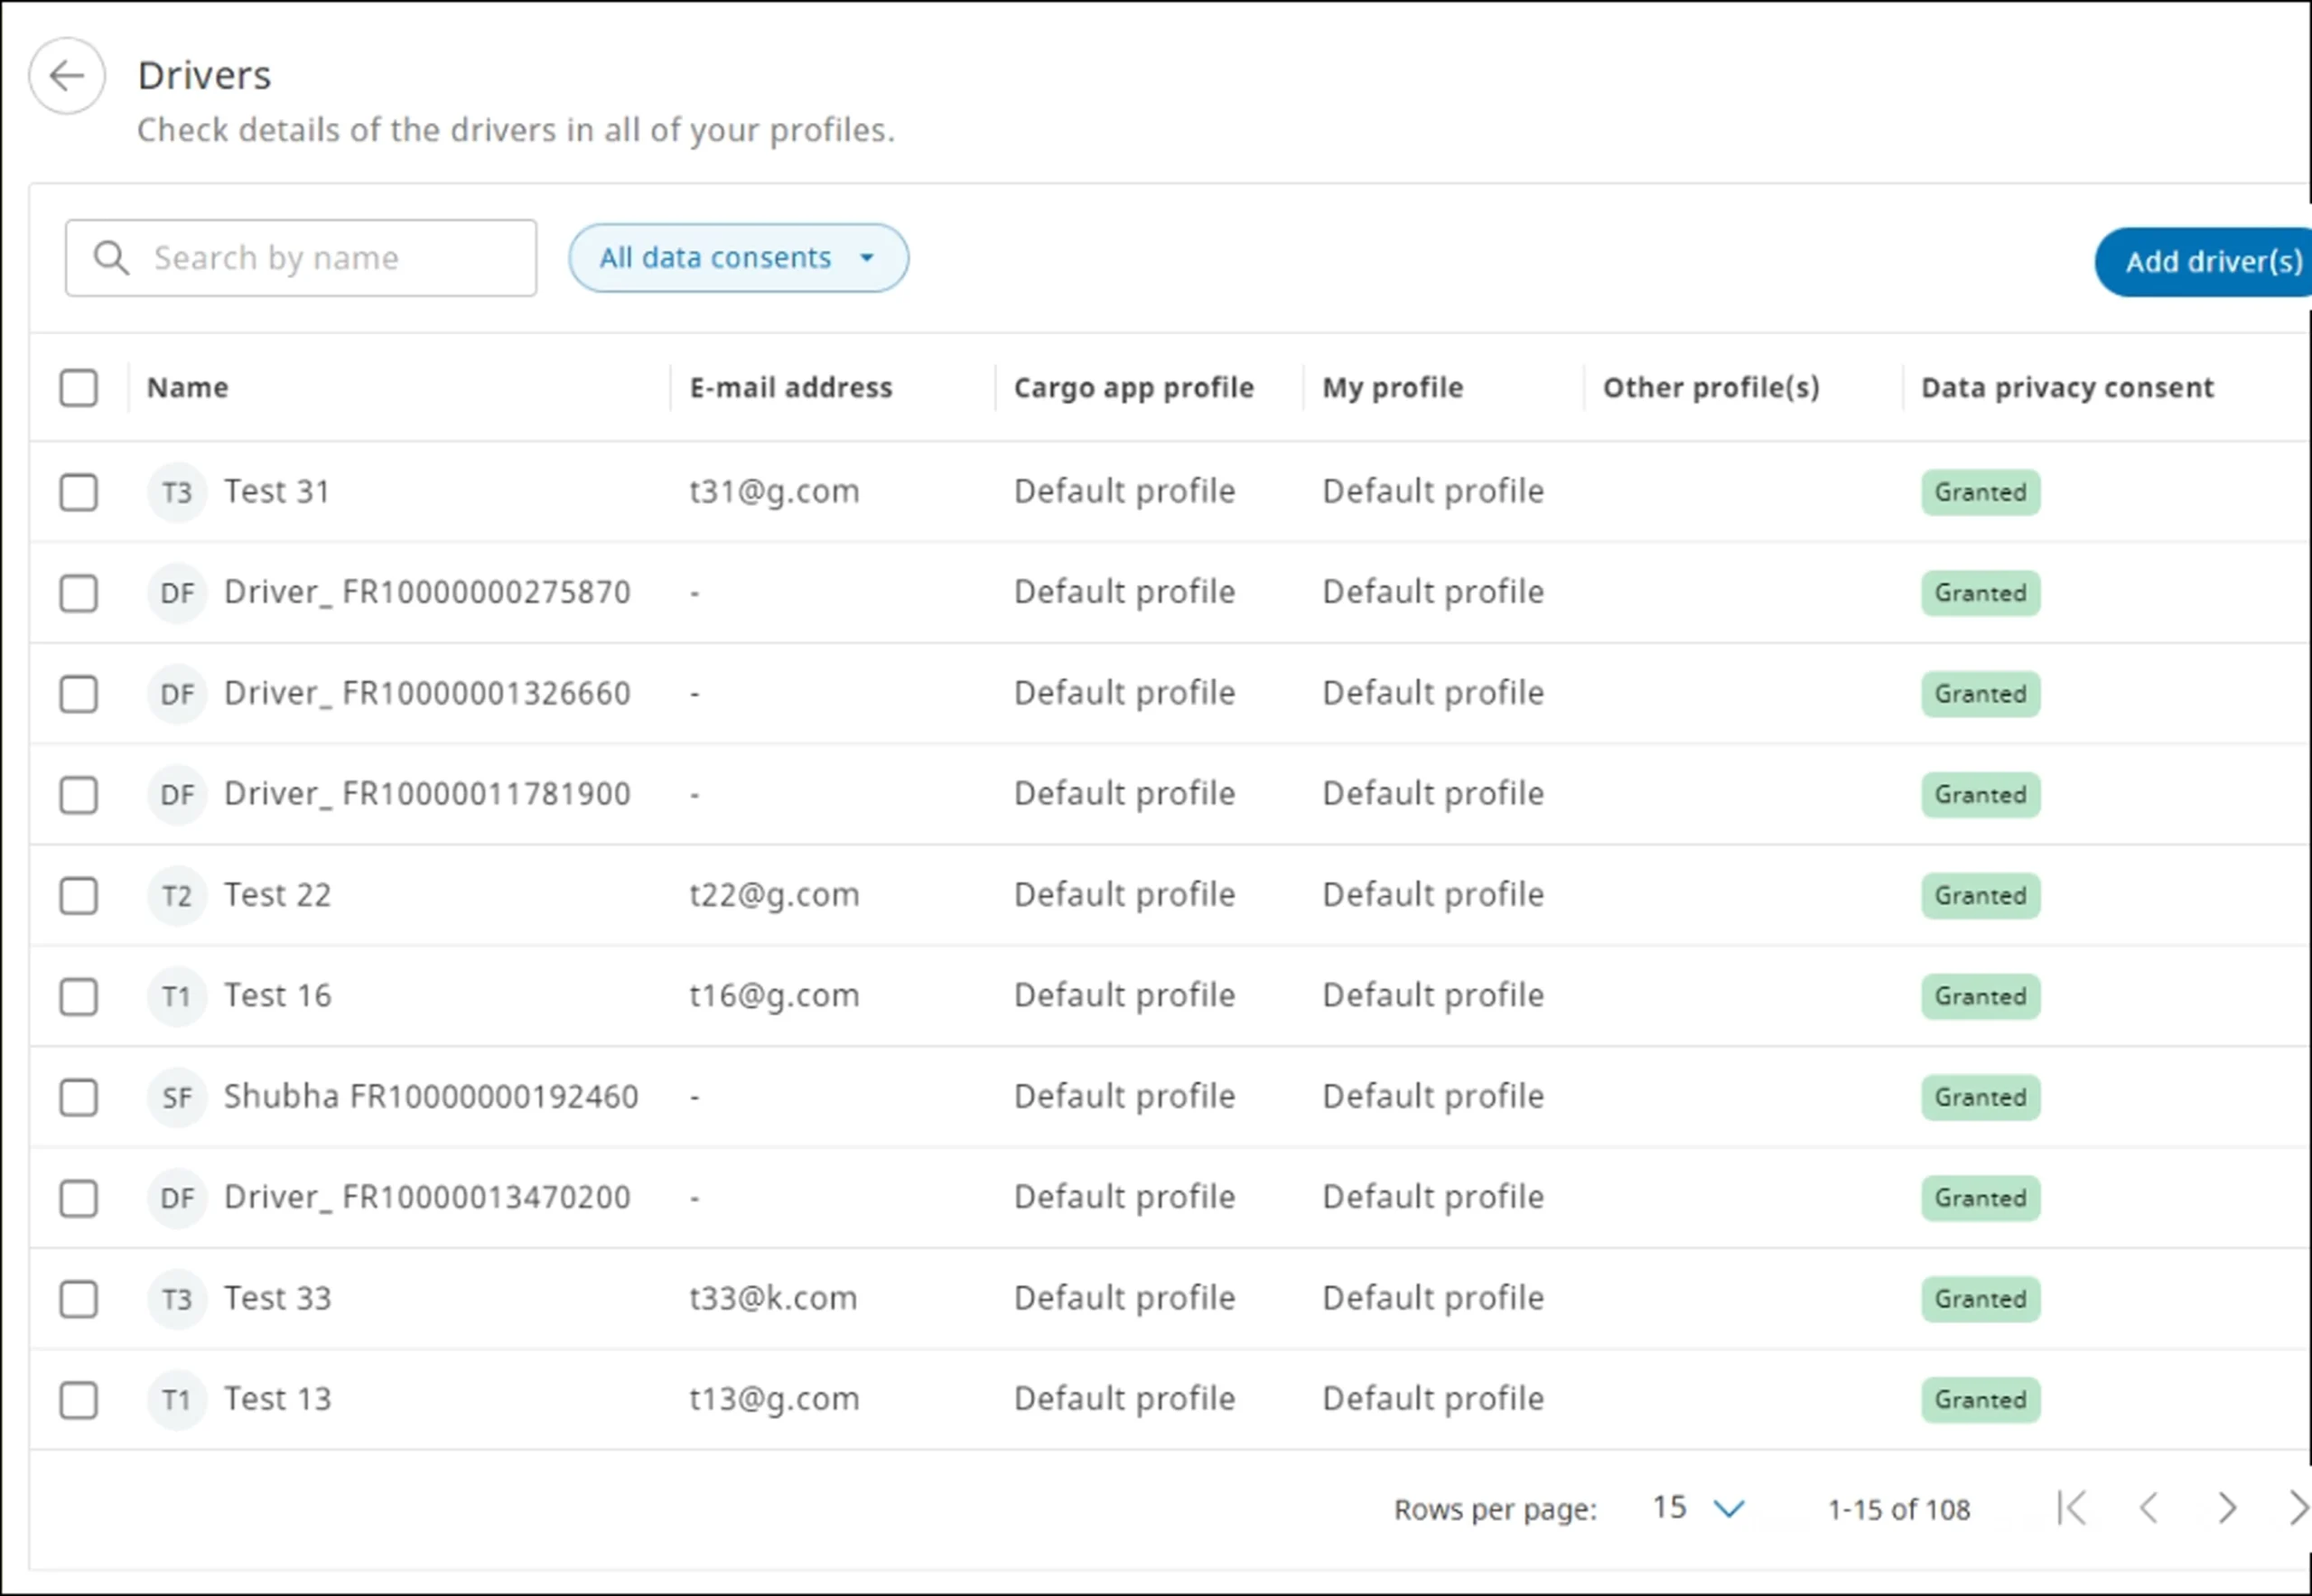
Drivers can be added from the Drivers tab.
Drivers must provide data consent for the usage of their data. A coach can approve the consent on behalf of the driver.
- On the ECO performance page, click Drivers. The Drivers page is displayed.

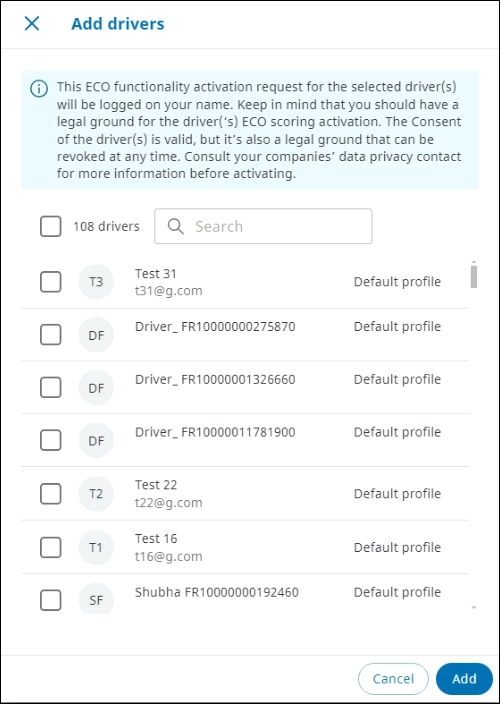
- Click Add drivers. The Add drivers dialog is displayed.
- Select the required drivers from the list, and then click Add. The selected drivers are added. By default, data consent is granted.
- To select all the available drivers, click the total number of drivers checkbox.
- Use the Search box to search a specific driver.
- To change the data consent status for specific drivers, select the checkboxes next to the required drivers. The Data consent option is displayed.

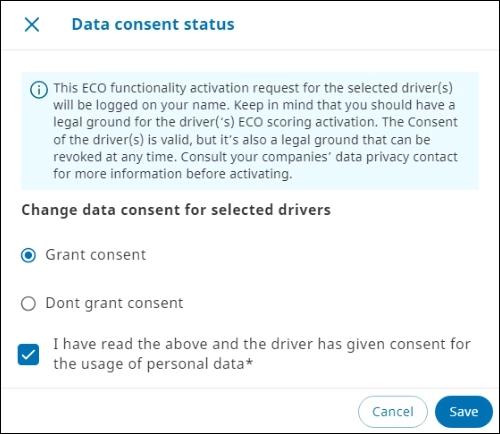
- Click Data Consent. The Data consent dialog is displayed.

- Do one of the following, and then click Save. The data consent status is updated.
- To allow data consent, select Grant consent, and then select the mandatory consent checkbox.
- To disallow data consent, select Don’t grant consent.
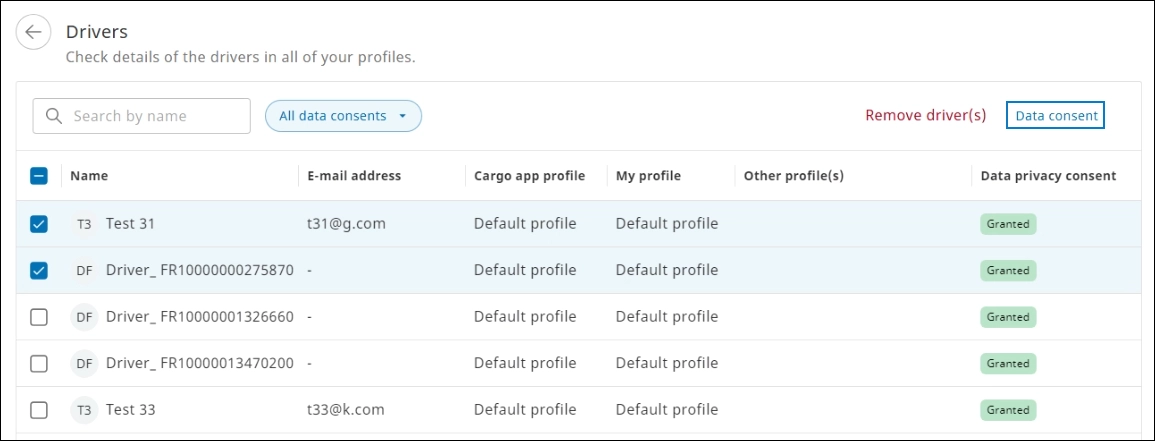
You can select one driver at a time to allow data consent permission. If you select more than one driver, the Data Consent option is unavailable. To remove a driver from the log, click Remove Drivers. Use the Search by name box to search a specific driver.
Consent Filter #
You can filter drivers on the Drivers page based on the data sharing permission status.
- On the Drivers page, click All data consents. The data consent filter options are displayed.

- Select the required option. The records are displayed on the Drivers page based on the selection criteria.
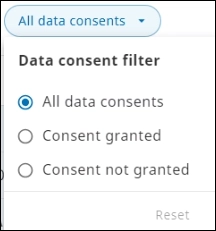
To restore the default setting, click Reset.
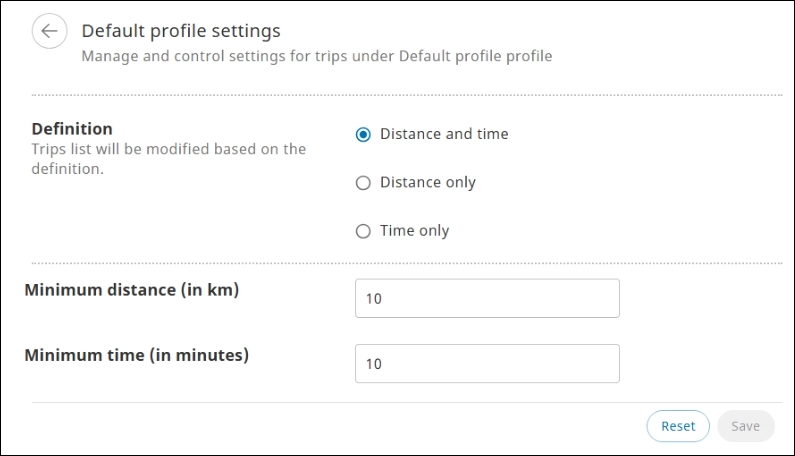
Configure Profile Settings #
You can manage and control settings for ECO trips for the profile created by you.
- From the left navigation pane, click ECO performance . The ECO performance page is displayed.
- Click Profiles. The Profiles page is displayed.
- Select the required profile from the My profiles tab, and then click Settings. The profile settings page is displayed for the selected profile.

- In the Definition section, select one of the options to modify the trips list based on the distance and time, distance only, and time only criteria.
- In the Minimum distance (in km) box, enter the value for the minimum distance traveled by the vehicle.
- In the Minimum time (in minutes) box, enter the value for the minimum time duration for a trip, and then click Save. The profile records are rendered on the page based on the settings configured.
You can only view and edit profiles you have created.
IMPORTANT
- Only trips that exceed the minimum distance or time values set are included in the trips list.


