

In the Map module, on the Assets tab, transport companies—more specifically, dispatchers—can track assets in the map view, check their status, such as driving, loading, or standstill, and view each asset’s historical data.
In the Map module > click the Assets tab, and select the required asset from the list. The asset’s current location and delivery route can be viewed on the map. In this example, the route for the selected vehicle
‘2-COOP-AIC-G03-019’ is charted on the map. 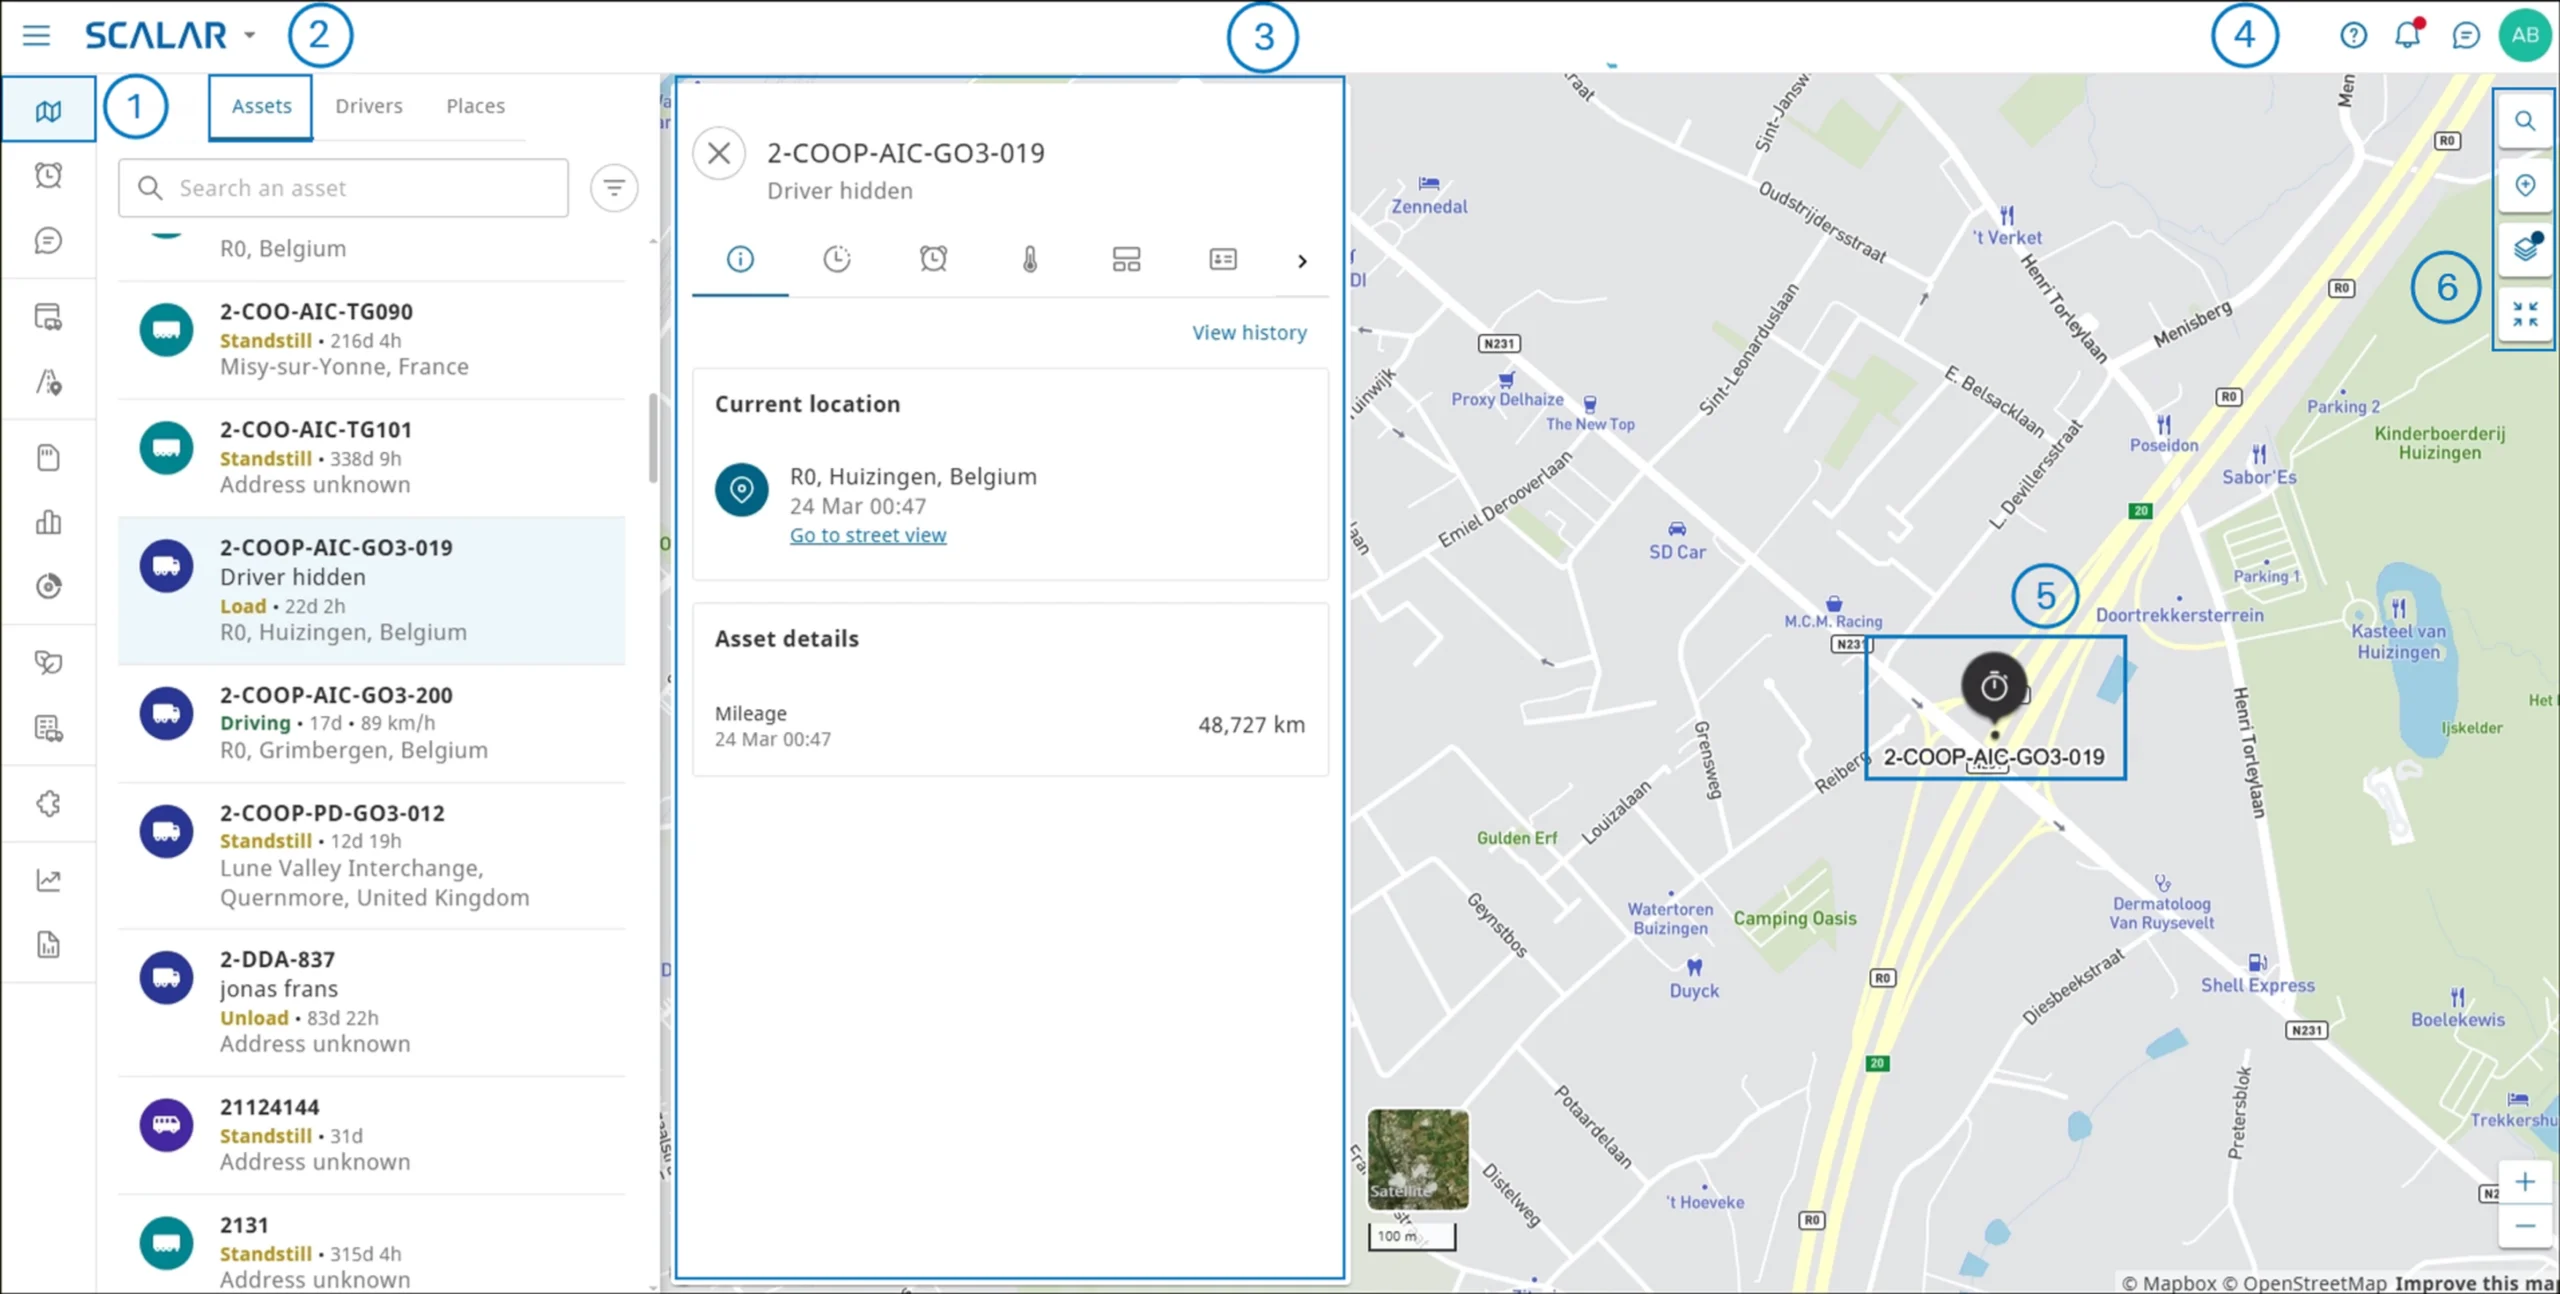
Element |
Action or description |
1 |
Click to go to the Map view |
2 |
Assets tab |
3 |
Asset information pane |
4 |
Map view |
5 |
Latest known location of the selected asset |
6 [Map buttons] |
|
|
Search an address, asset, location, or coordinates on the map |
|
Create a place |
|
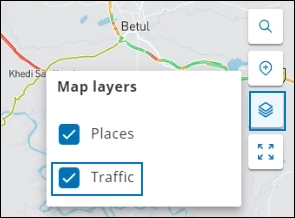
Show or hide map layers
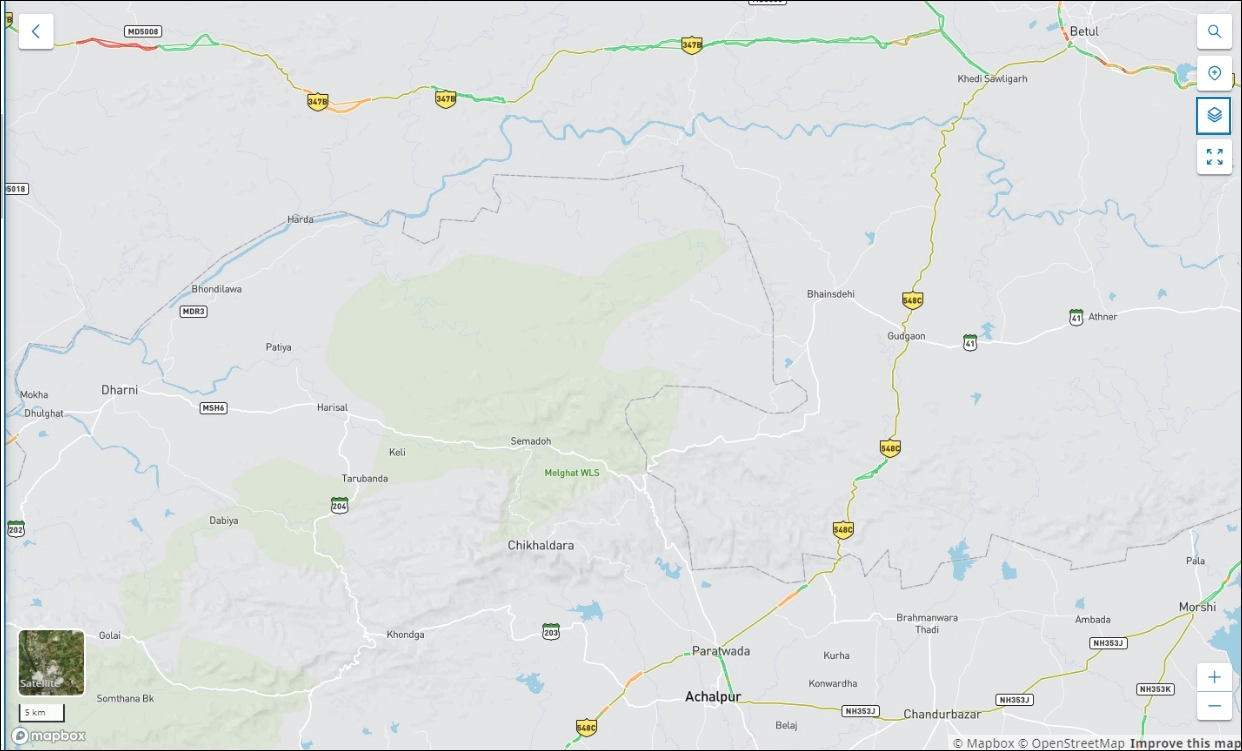
The places and traffic information is displayed on the map.
NOTE:
You can zoom in to view the live traffic information. Traffic information is updated every 8 minutes on the Mapbox server. If no panning or zooming occurs on the map, no new data will be retrieved. |
|
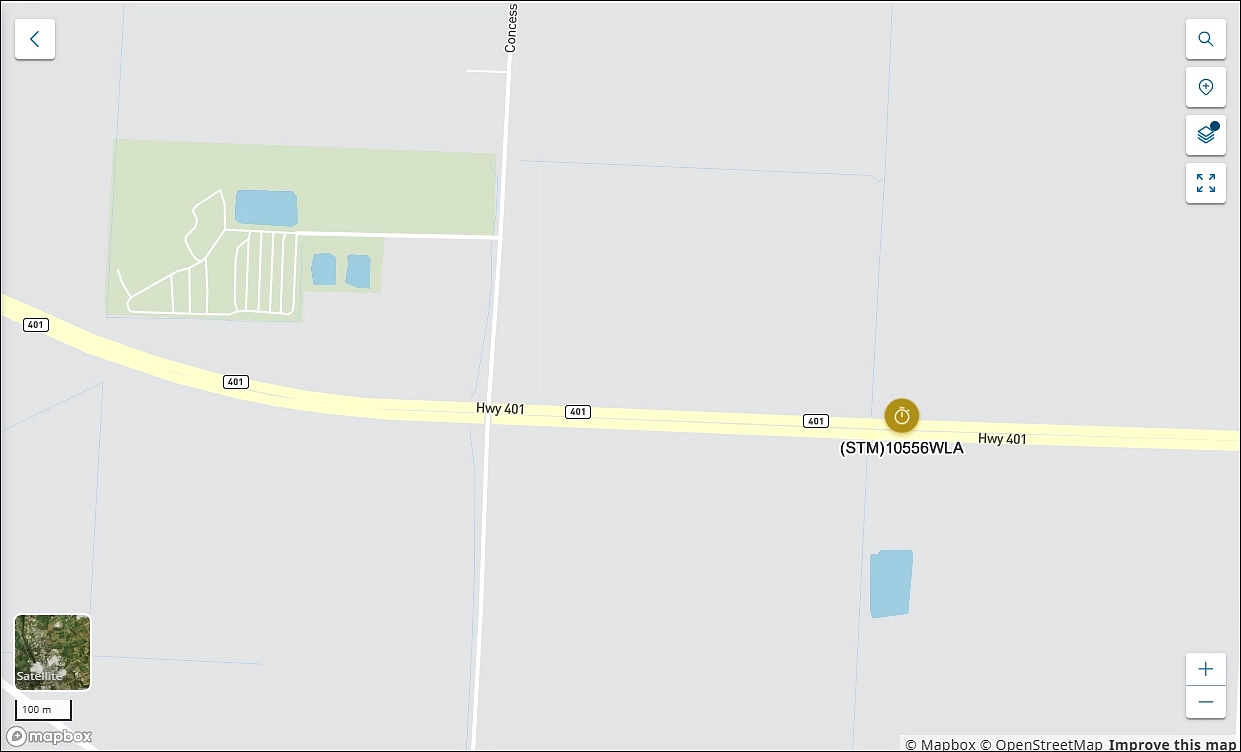
If no asset is selected on the Assets pane, all the assigned assets on the map are shown.
|
|
Zoom in and out on the map area |
|
Switch to satellite view |

Asset Information pane #
From the asset information pane, you can view and monitor the asset’s general information, activities, alarms, temperature, service times, tachograph data, and notes that are recorded on various tabs. You can view historical data on the General info, Activities, Alarms, and Reefer tabs.
In the Map module > click the Assets tab, and select the required asset from the list. The asset information pane is displayed with the asset’s general information.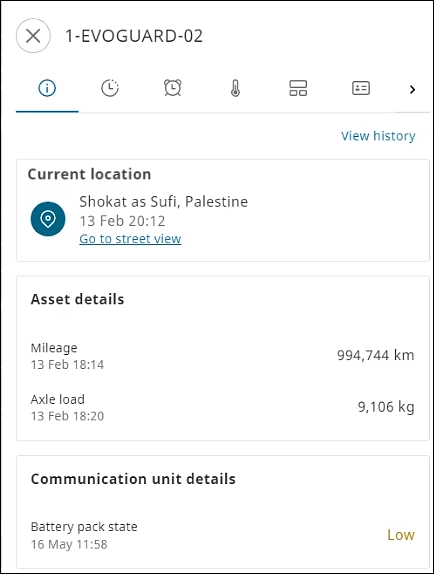
This section describes the asset information recorded on various tabs.
General info #
You can view the general information of an asset, such as location details, including the Google Maps street view, asset details (mileage / axle load), and communication unit details.
On the asset information pane > go to General info ![]() . The location, asset details, and communication unit details are displayed.
. The location, asset details, and communication unit details are displayed.
Switch to street view #
You can switch to the street view for the selected asset on the map.
On the General info tab > go to the Current Location section, and then click Go to street view.
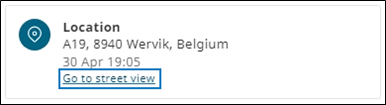
The Google street view for the selected asset is displayed in a new tab window. This is a representative image of the Google Maps street view.

Asset details #
You can view the mileage, fuel level, axle load, TBS warning, and TPMS information for the selected asset in the Asset details section on the asset information pane.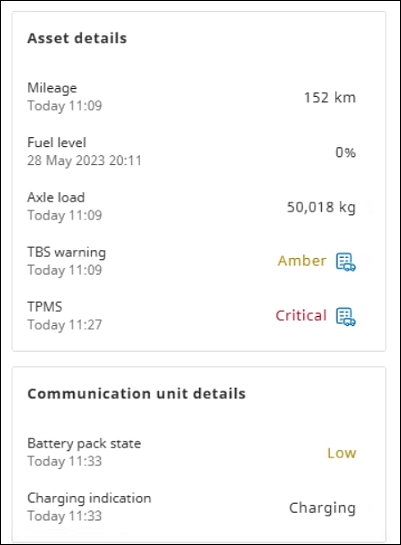
- In the TBS warning field, None represents the brake performance status of the asset.
- EV information is displayed for electric or hybrid vehicles. For more information, see the next section.
EV information #
In the Asset details section, you can track the live status of EVs (electric vehicles), the remaining charge, the estimated range of the asset (estimated distance the vehicle can travel before it must be recharged), status of recharging, and verify whether the temperature is optimal for charging.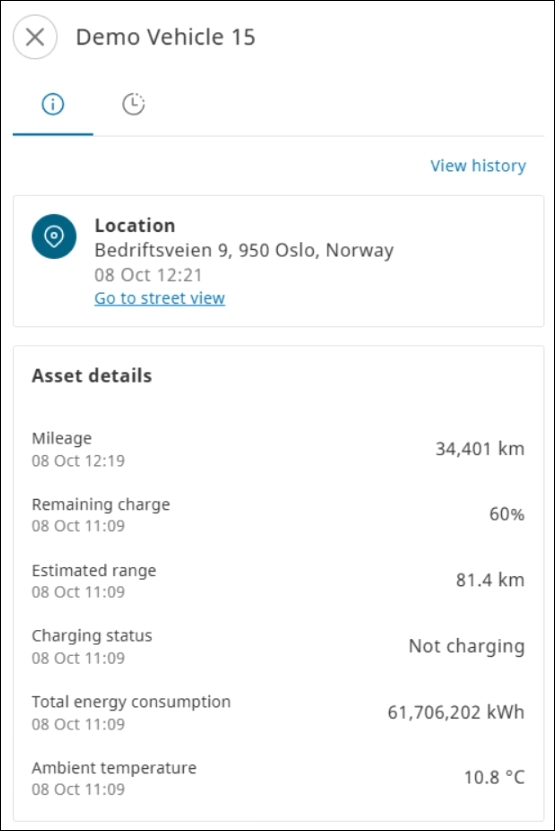
The possibility of showing certain data regarding EV depends on both the asset and the communication unit that is connected.
Currently, the integration is validated with SCANIA through MCU (Multi Controlller Unit) integration. However, other integrations are possible in future. Please contact the Service Desk for more details regarding possible integrations.
Activities #
The asset activities are recorded on the SCALAR platform, such as driving, standstill, load, unload, and refuelling. You can trace an asset’s activities, view its status and current position on the map, and check responses submitted by a driver.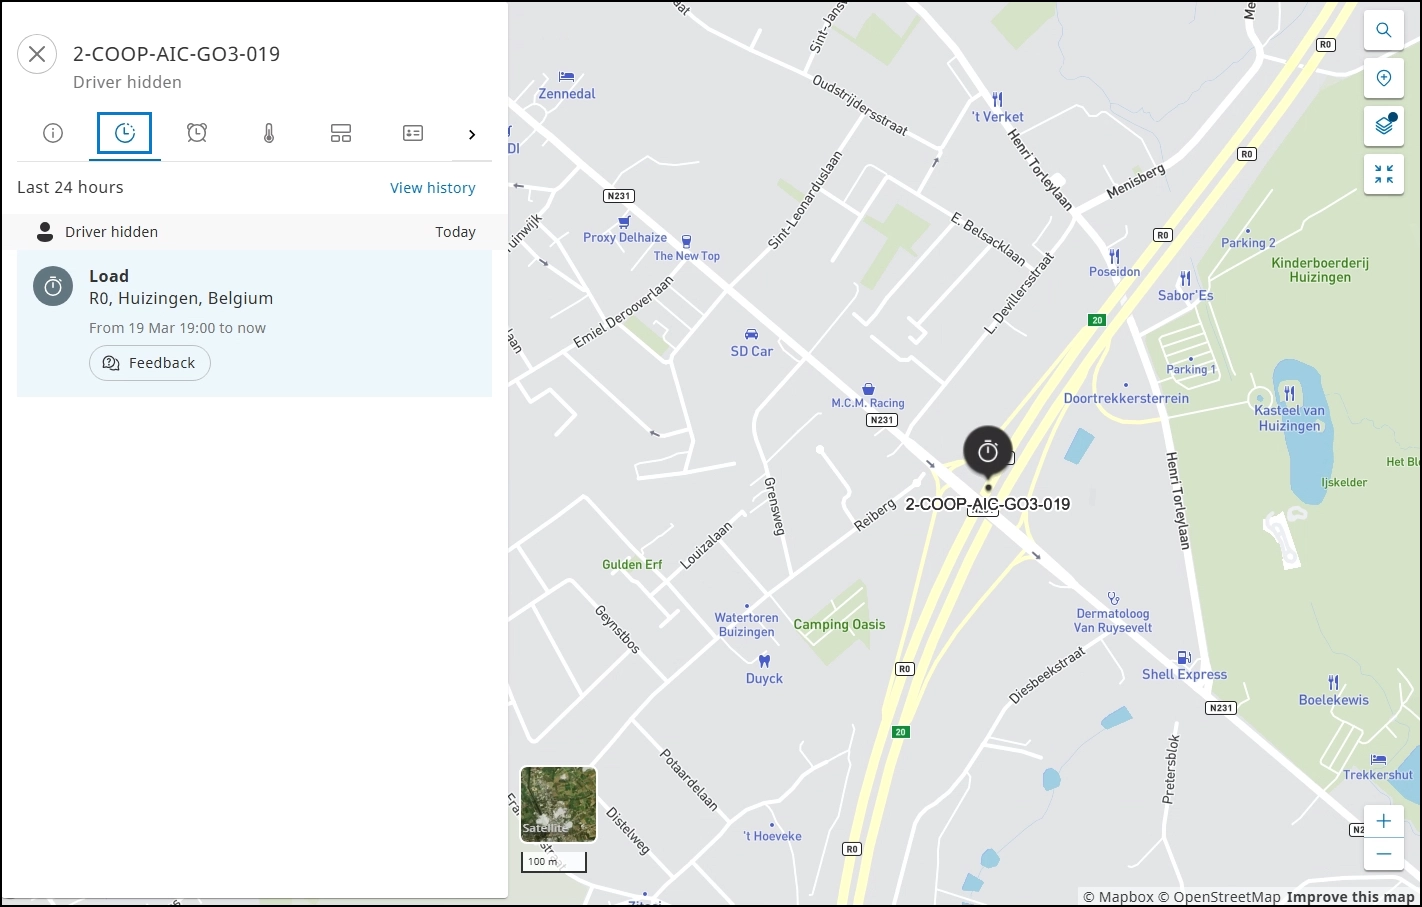
View grouped assets/activities #
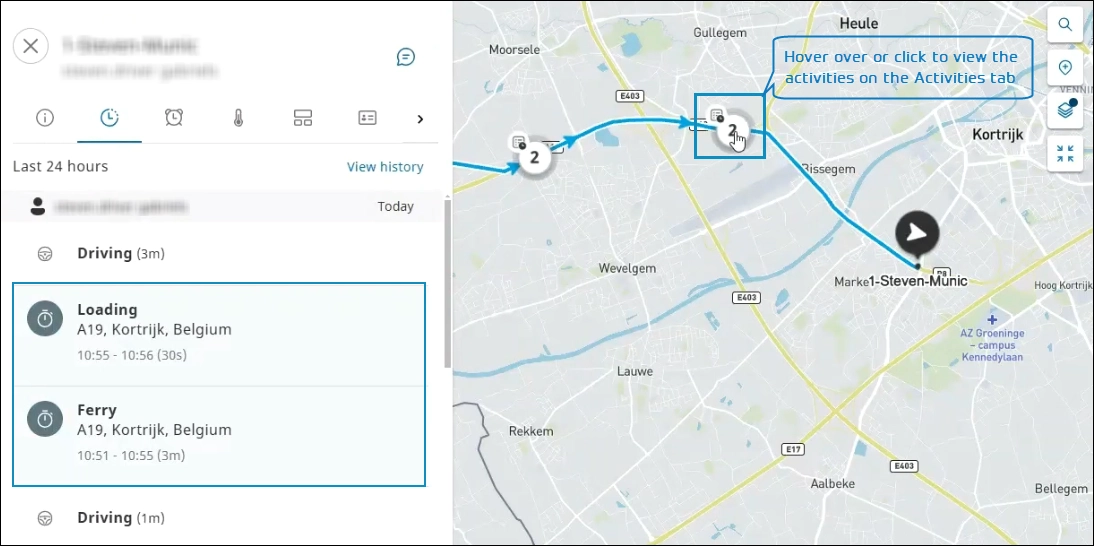
Assets at the same location (or in close proximity) are grouped on the map, indicated with a truck icon: ![]() The number denotes the number of assets at the location. Click the group icon to zoom in to view the assets separately.
The number denotes the number of assets at the location. Click the group icon to zoom in to view the assets separately.
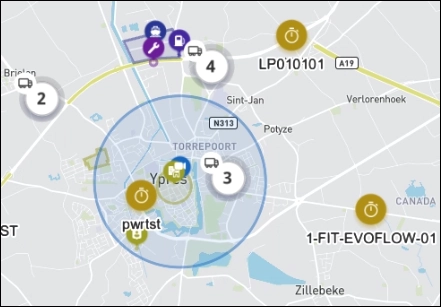
Multiple activities performed at the same place are grouped on the map, indicated with an activity icon: ![]()
The number denotes the number of available activities. Click the group icon to zoom in and view the activity details on the Activities tab.
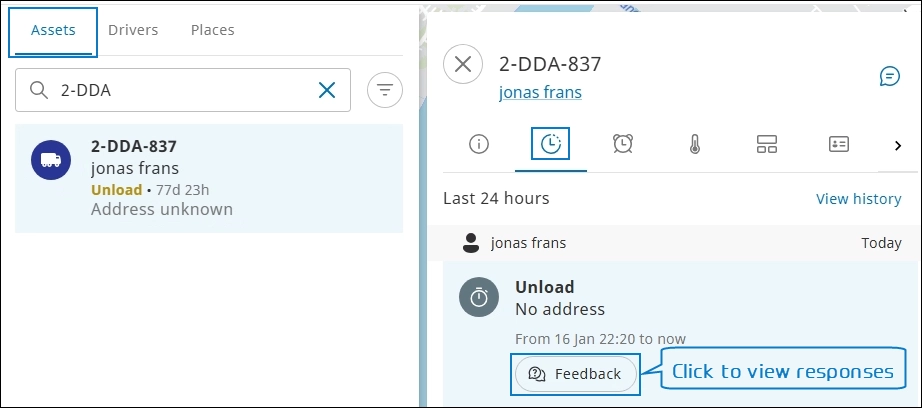
View feedback #
On the Activities tab, click Feedback to view the driver responses.
Alarms #
You can view the recorded alarms history triggered by assets and initiate appropriate measures based on the alarm category.
On the asset information pane > click Alarms ![]() . The recent alarms (last 24 hours) recorded are displayed.
. The recent alarms (last 24 hours) recorded are displayed.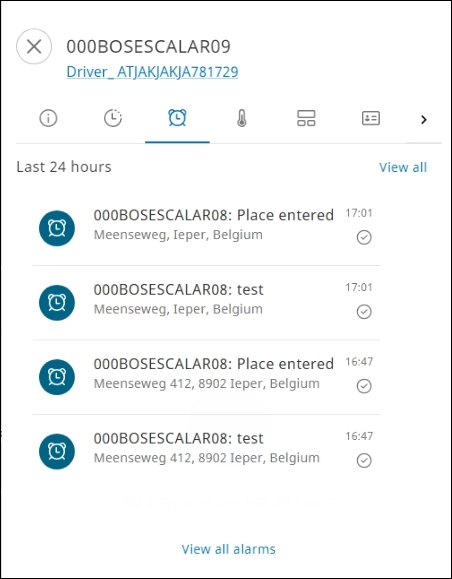
Click View all to view all the recorded alarms history available for the selected asset. For more information, see View all alarms.
Reefer #
The Reefer (temperature monitoring) function helps ensure that optimal temperature for an asset is maintained during transport.
On the asset information pane > click Reefer  . The recent temperature records for the asset are displayed.
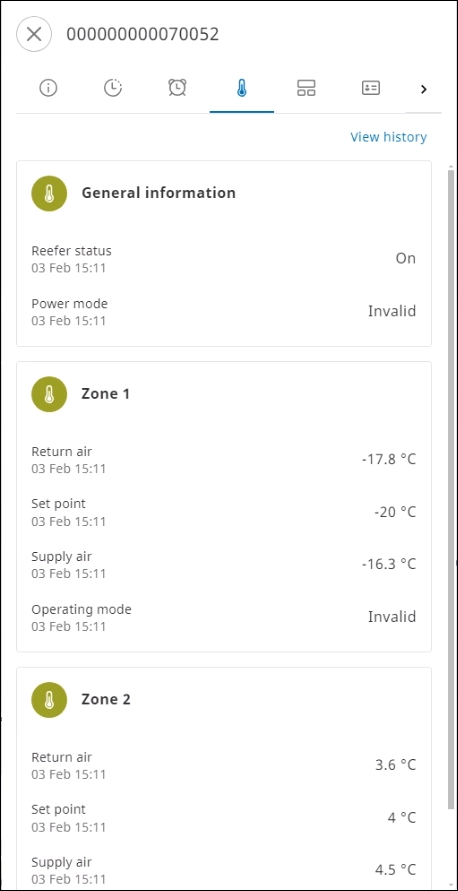
Remaining (Service time) #
You can view service time information: driving and resting time data of the drivers to ensure that they are following the applicable rules and regulations.
- On the asset information pane > click Remaining
 . The information is displayed in the Service Time section.
 - Select the Driving or Resting tab. The information for the selected option is displayed in the Service Time section.

 . The information is displayed in the Service Time section.
Tachograph #
Tachograph data is recorded for assets, driver activities, and service times, which include current driving time and resting time.
On the asset information pane > click Tacho  . The recent available tachograph data is displayed.
- Tachograph data is legacy data that cannot be edited.
- If no driver is assigned to an asset, you cannot view data in the Remaining and Tacho tabs.
Notes #
Dispatchers can use the Notes functionality that can be referenced by themselves or other dispachers to communicate important or critical information with the drivers for an asset. These notes can also serve to follow up or assist a driver by providing vital information or tips during a trip.
- All dispatchers who can access the Track & Trace module and follow a specific asset can view the note added for that asset.
- A maximum of 1000 characters can be added to a note.
- A maximum of five notes can be added per asset.
Add Note #
- On the asset information pane, click > to view Notes
 . The Organization notes section is displayed.
- Enter information in the box, and then click Save. The note is inserted.

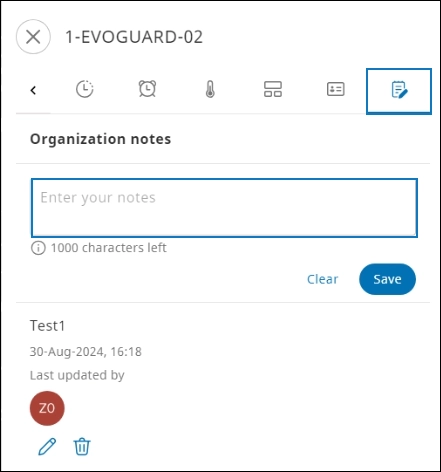

Edit Note #
Click Edit (![]() ) to make modifications to the note. The note is now in editable mode. Click Save to save your changes. The note is updated.
) to make modifications to the note. The note is now in editable mode. Click Save to save your changes. The note is updated.
Delete Note #
Click Delete (![]() ) to remove a note. A confirmation message is displayed. Click Delete to confirm deletion. The note is permanently deleted.
) to remove a note. A confirmation message is displayed. Click Delete to confirm deletion. The note is permanently deleted.
View Asset History #
You can view the asset history on the General info, Activities, and Reefer tabs.
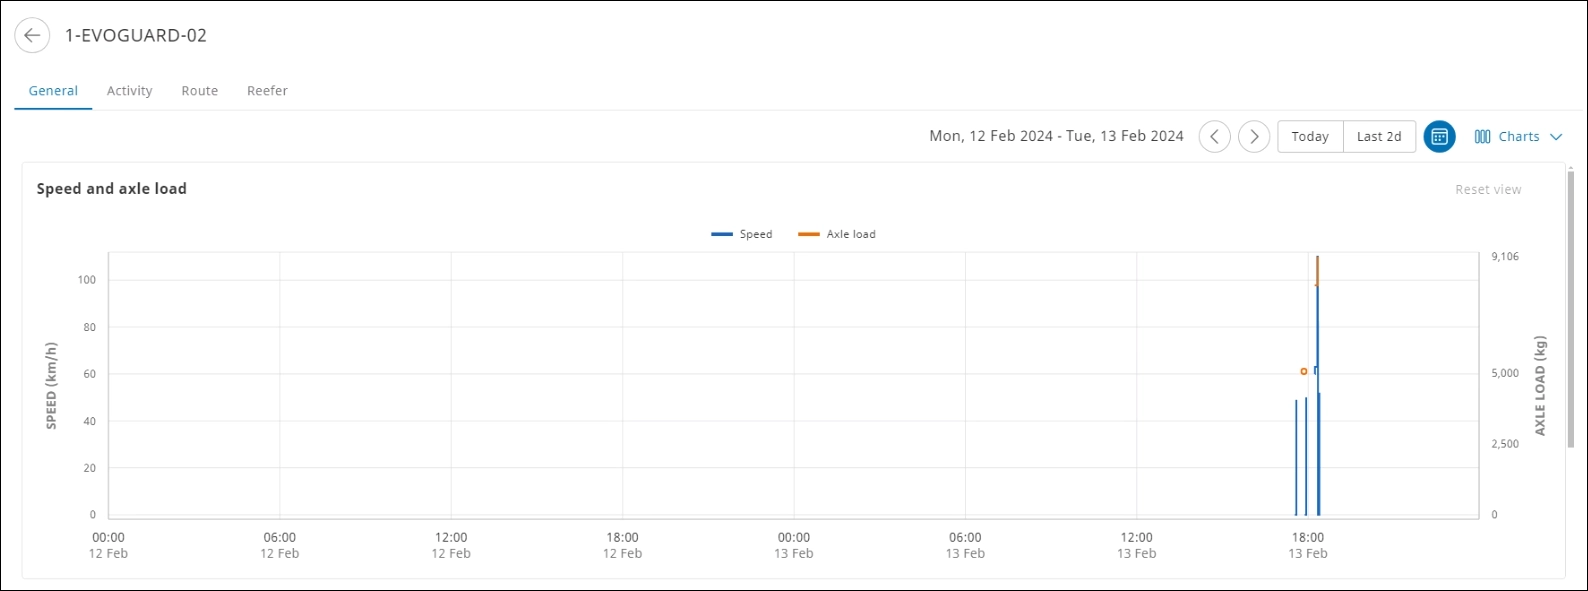
View speed and axle load, fuel level data, and battery voltage data history #
On the General info tab, you can view speed and axle load data for the defined period for the selected vehicle.
- On the asset information pane, select the required asset.
- On the General info tab, click View history. The General tab is displayed that charts the speed and axle load, fuel level data, and battery voltage history.

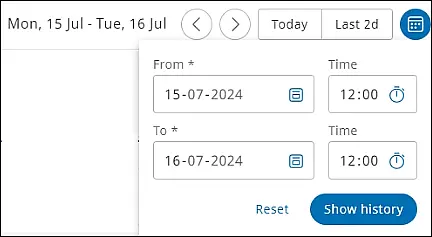
- From the toolbar, click the calendar picker
 , and select the required date and time range.
 - Click Show history. The speed and axle load data history for the specified period is displayed.

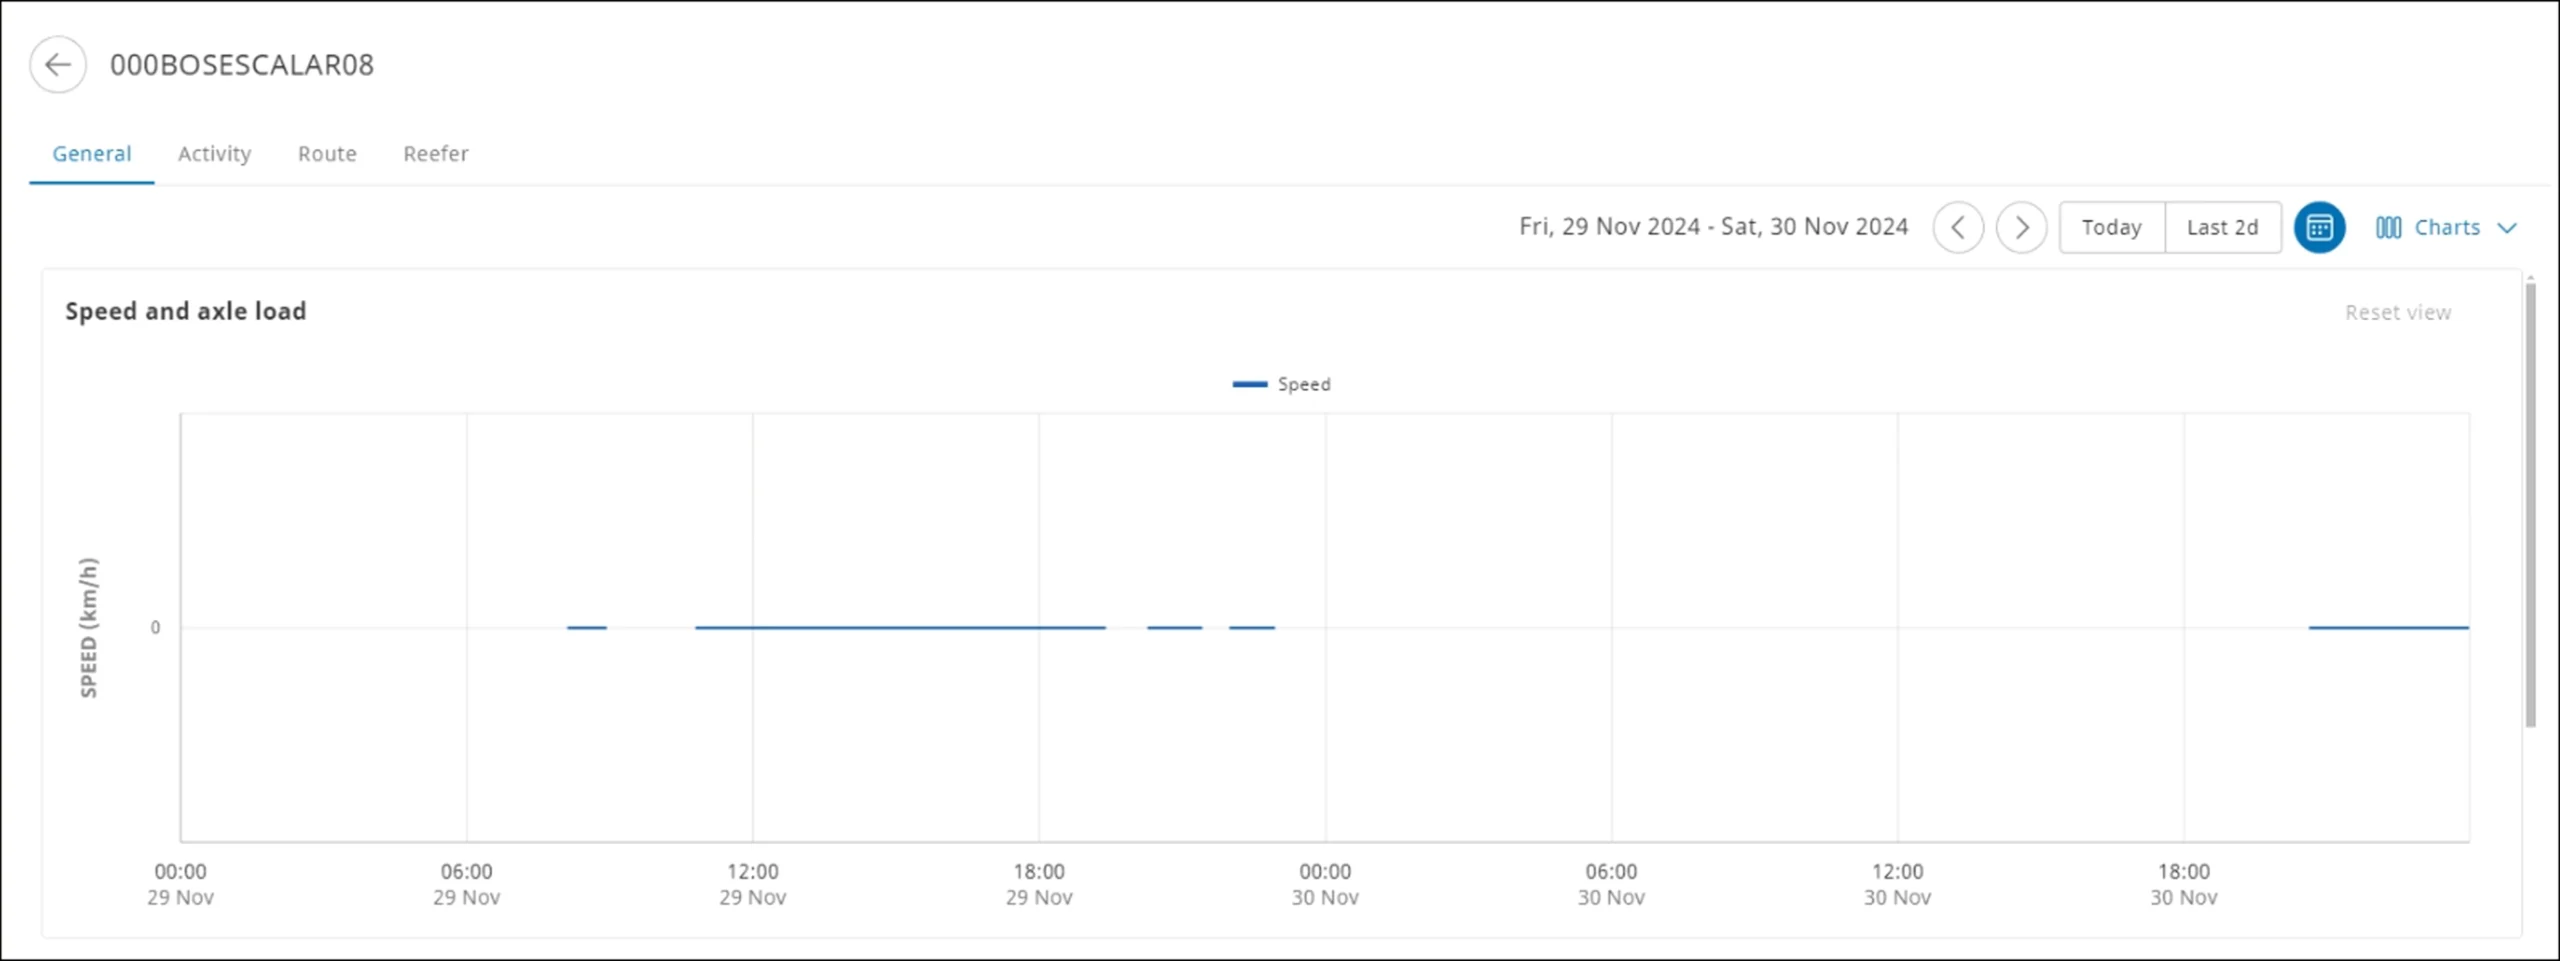
Scroll down to view the fuel level and voltage battery data.
On the asset information page, you can also view the activity, route, and reefer details of an asset.
To view data for the current date, select Today from the calendar picker.
The maximum period you can select is two days. You can also select one of the predefined options to view the speed and axle load data history.
Customize charts #
You can select or clear the checkboxes to selectively view the available charts.
- On the General tab > click Charts. The Chart Display list is displayed.

- Select the required checkboxes. The selected charts are displayed.

To restore the default settings, click Reset.
View activity history #
You can view the activities history for the selected vehicle during the defined period.
- On the asset information pane, select the required asset.
- On the Activities tab, click View history. The Activity tab is displayed.
- Select the date range from the calendar picker, and then click Show history, or select from the predefined options. The asset activities recorded during the selected period are listed.
The maximum period you can select is one month.
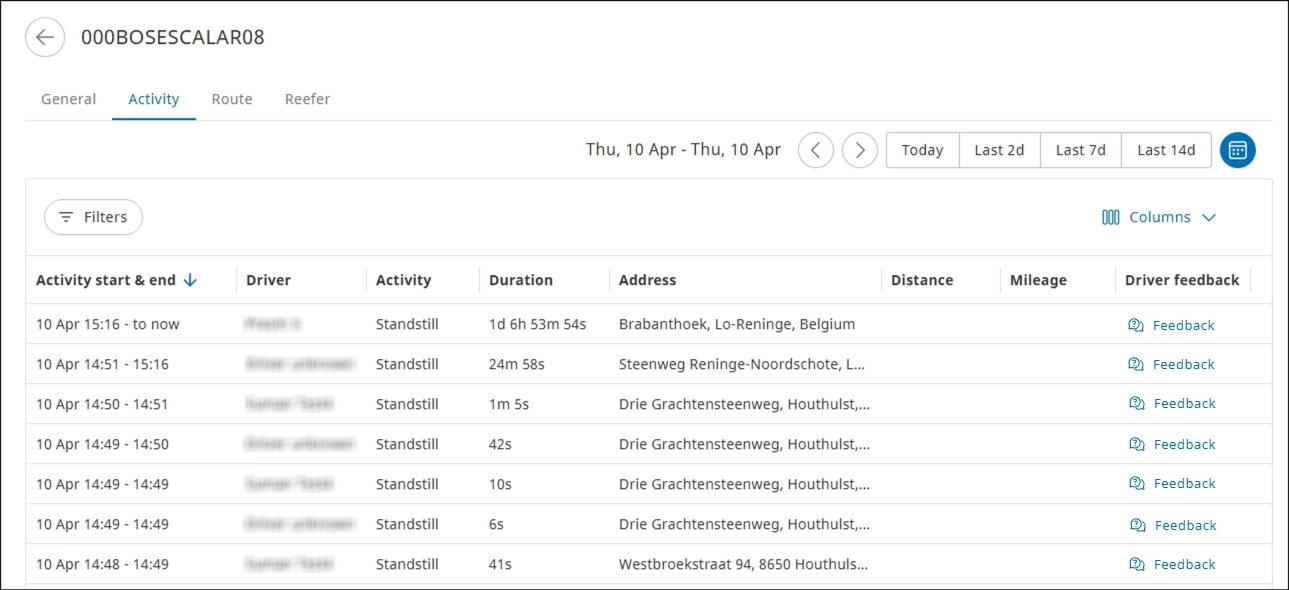
Click Feedback to view the responses submitted by the driver during trip execution in the SCALAR Cargo app.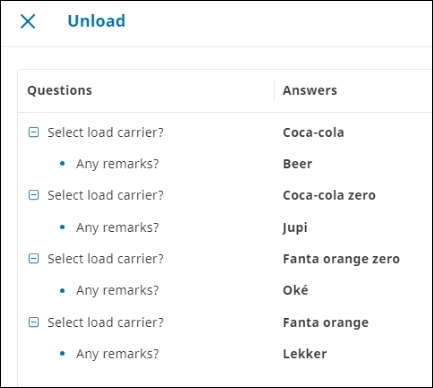
Customize columns #
You can customize the view to show or hide columns while viewing records on the Activity tab.
- On the Activity tab > click Columns. The Chart display list is displayed.

- Select the required checkboxes that correspond to different columns. The colums selected are displayed while viewing the records.
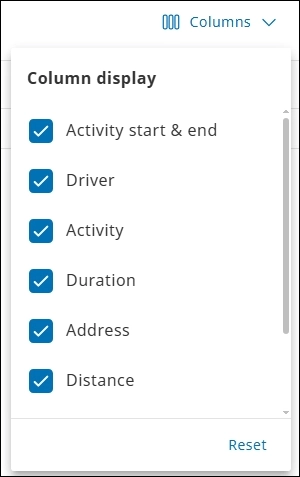
To restore the default settings, click Reset.
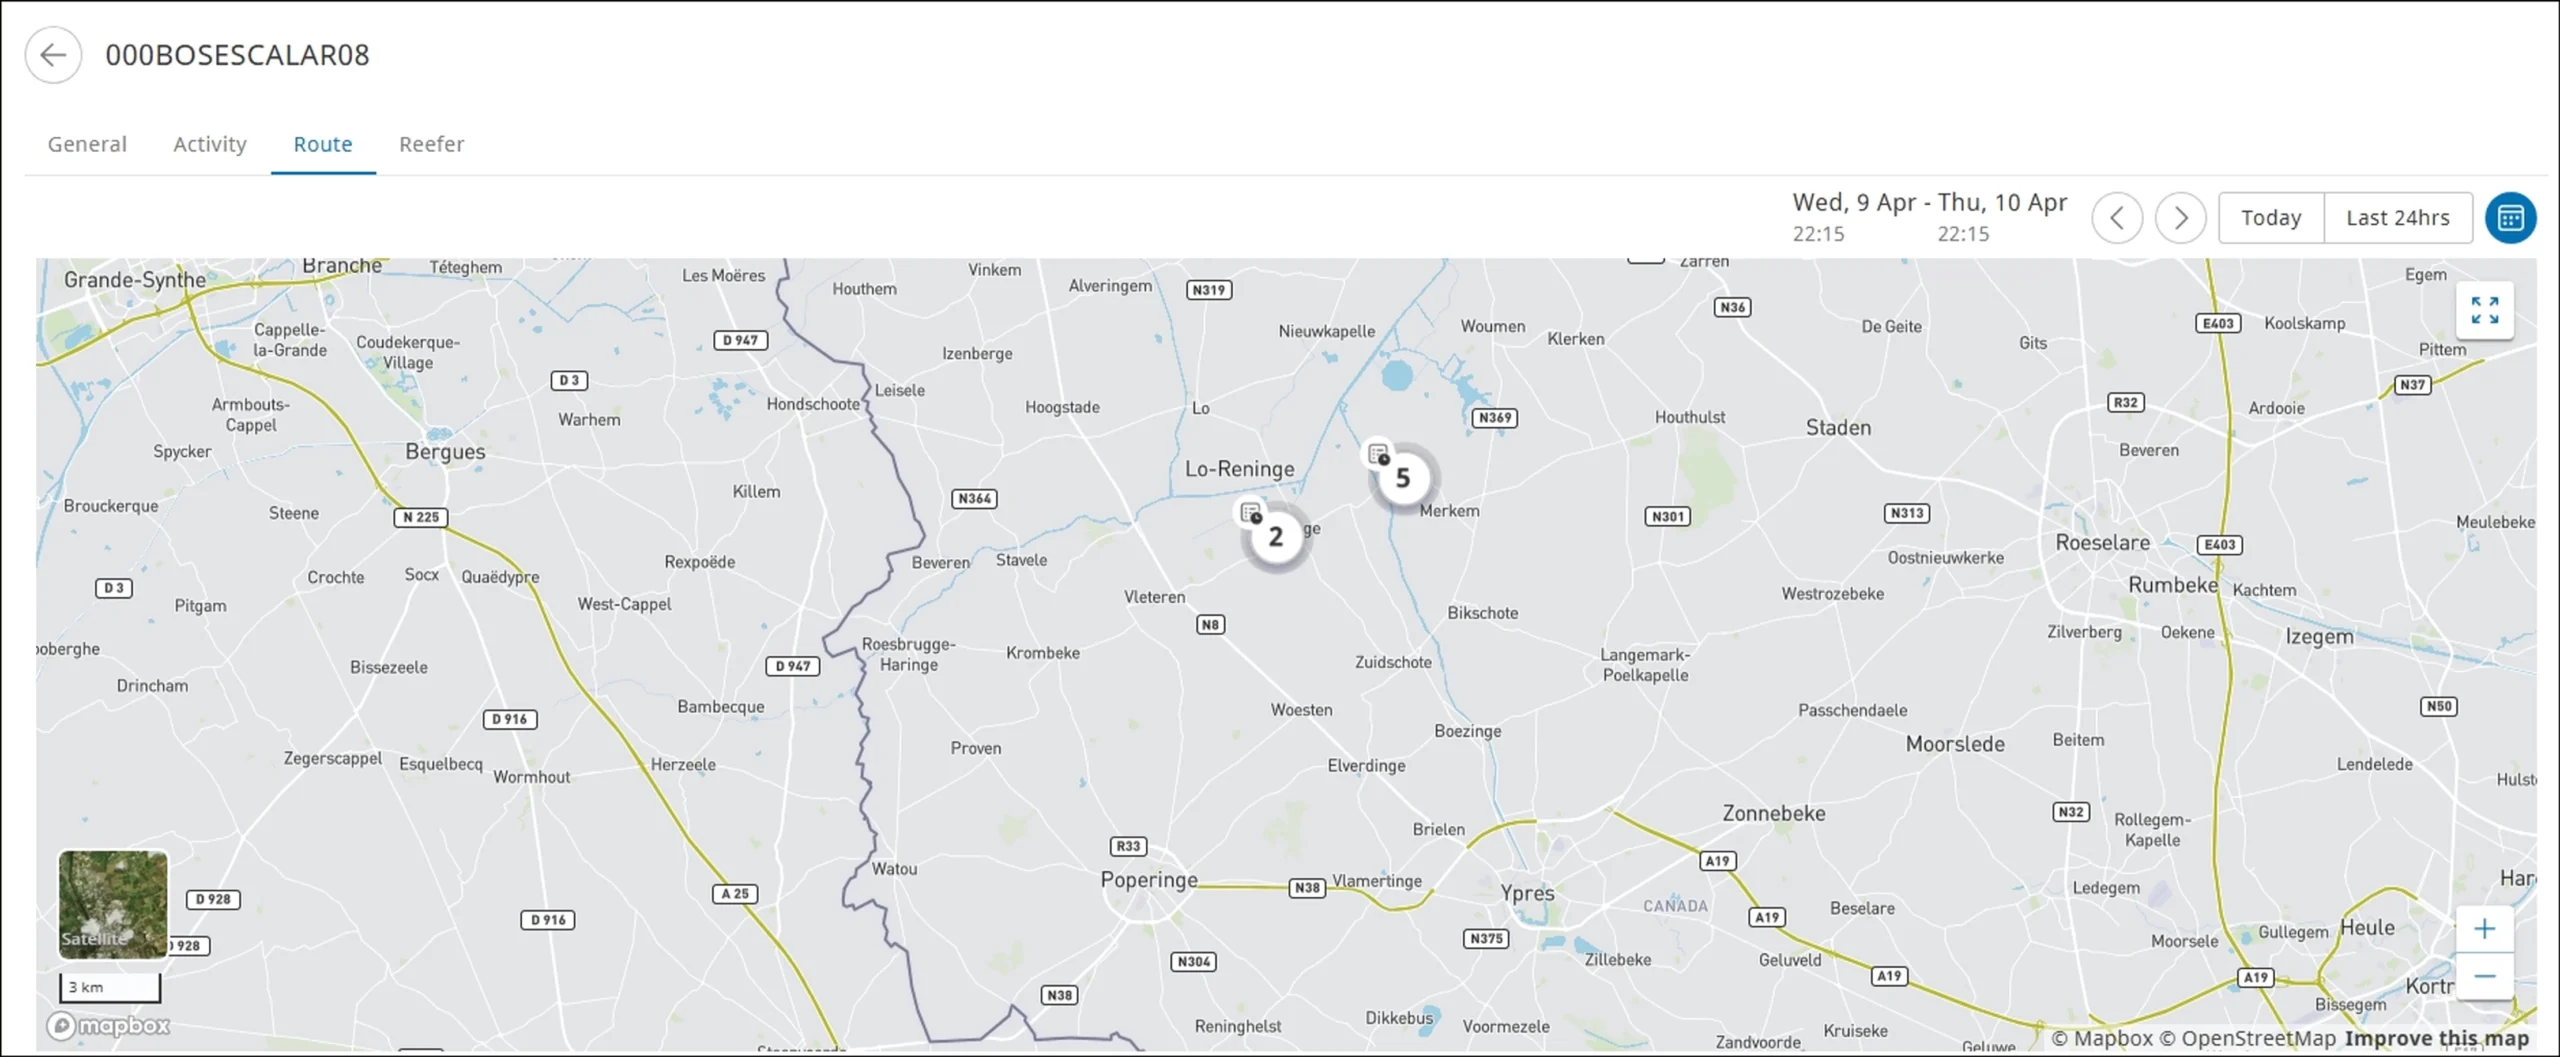
View route history #
You can view the route traversed by the selected asset for the defined period.
- On the asset information pane, select the required asset.
- On the General info tab, click View history.
- Click the Route tab.
- Select the date range from the calendar picker, and then click Show history, or select from the predefined options. The route charted during the selected period is shown.

View reefer data history #
- On the asset information pane, select the required asset.
- On the Reefer tab, click View history. The Reefer tab is displayed.
- Select the date range from the calendar picker, and click Show history, or select from the predefined options. The temperature information recorded for the asset for the selected period are displayed.
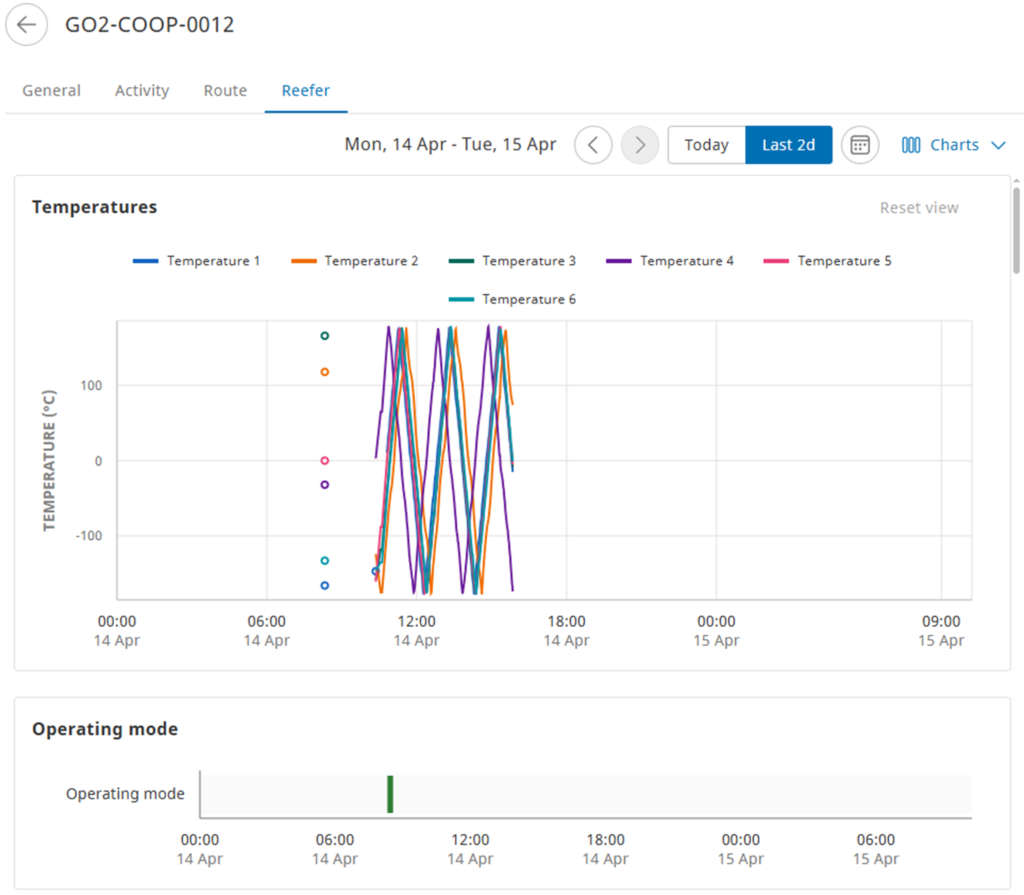
The maximum period you can select is two days.
You can select or unselect the checkboxes to show or hide the available charts. For more information, see Customize charts explained in an earlier section.
Filter assets #
You can filter assets based on their activity, asset type, system tags, and visibility on the map.
- In the Map module > on the Assets tab, click Filter
 . The Asset filter pane is displayed.
- Select the required checkboxes in the Activity, Asset type, System tag of the asset, and Map sections, and then click Done. The asset records that fulfil the criteria are listed.
Available filters: - Activity
- Asset type
- System tag of the asset: Pending (An asset was created, but no incoming data has been received yet)
- Map: Show assets visible on map. The filtered list will be updated as you move the map or zoom in or zoom out.
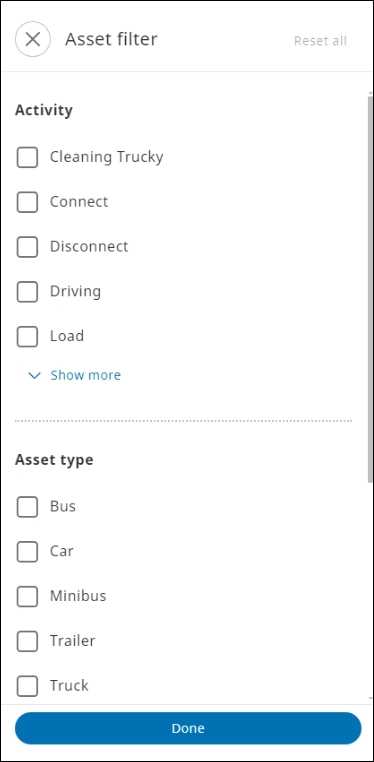
You can select multiple checkboxes in the Activity and Asset type sections.
Search an asset #
You can search specific assets from the Assets tab.
In the Map module, click the Assets tab, and enter a name in the Search an asset box. The search results matching the search criteria are displayed on the Assets pane.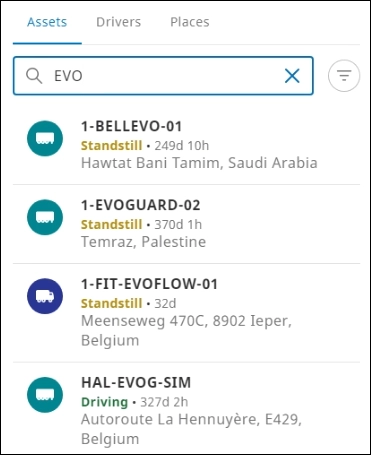
Enter at least three characters to start a search operation.


